Outlook for the Economy, Real Estate and REITs in 2020: What to Look for in Uncharted Waters

The U.S. economy followed a somewhat predictable cyclical pattern from the end of World War II until the 2000s. GDP and employment growth would accelerate as the economy got up to speed after a downturn. Eventually, as the unemployment rate moved lower and lower, wage growth and inflation would accelerate. In response, the Federal Reserve would raise short-term interest rates higher than long-term rates, causing the yield curve to invert; the economy would slow and usually enter a recession. After things cooled off, the Fed would lower rates and the process began anew. This “business cycle” was repeated regularly every four to six years. Demand for commercial real estate has historically been closely tied to this macroeconomic cycle.
This time it really is different. The economy has continued growing for more than 10 years, the longest expansion on record and nearly twice the average length seen over the prior 70 years. Furthermore, despite the unemployment rate falling to the lowest in 50 years, there are few signs of inflation. There is no historical precedent to study for clues about what might come next. What markers can we rely on as the economy and commercial real estate move into these uncharted waters?
Fortunately, there are still features of the overall economy and of commercial real estate markets that can help us gauge the risks of a downturn in the months and years ahead. Most of these factors have provided consistent warning signals ahead of prior downturns.
To preview the conclusions of the analysis that follows, the outlook is positive, as a wide range of indicators from GDP, labor markets, housing markets and commercial real estate are consistent with continued economic growth and improving real estate markets and REIT earnings in 2020.
Economic Fundamentals Remain Healthy
The composition of GDP matters
Recession risks are moderate when the more cyclical components of GDP are below their long run average. Keep an eye on business investment, construction and consumer durables in the year ahead.
It’s not the level or growth of GDP or the age of the expansion that provide the most reliable clues about recession risks. It is the composition of GDP that matters. Consumer spending is the largest sector of the U.S. economy, accounting for about 70% of GDP but, surprisingly, does not play nearly as large a role in cyclical swings. During the Great Recession a decade ago, weakness in consumer spending was not the main cause of falling GDP. In fact, over the second half of 2008 and first half of 2009, GDP fell 3.9%, but only 1.5 percentage points of this decline were due to consumers; a plunge in investment spending by businesses and homebuilders contributed 4.5 percentage points to the overall decline.
Consumers can trim spending on the margins, but cannot slash spending in many areas—food, clothing, transportation, heat and light for your home. But businesses can postpone or cancel major investment projects like constructing a new factory or office building.
To gauge how vulnerable the economy is to recession risks, therefore, one should pay close attention to the more cyclical components of GDP. These include business investment in equipment and software, nonresidential structures, homebuilding, and consumer purchases of durable goods like autos, furniture, and appliances. These cyclical components comprise about one-quarter of overall GDP, but account for the lion’s share of declines in GDP during recessions.
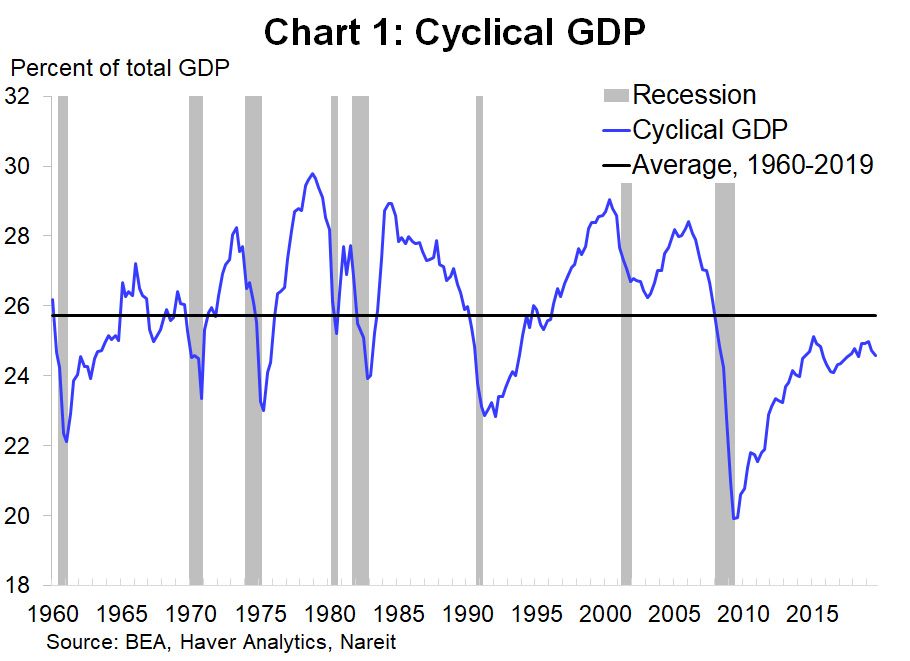
Every recession over the past 70 years occurred at a time when cyclical GDP was well above its long-run average, and during every recession except 2001, fell to below average. Growth of these cyclical components, however, has been modest over the past decade, and cyclical GDP is still below average. If recessions happen when businesses trim the fat, these days still look pretty lean. Low levels of cyclical GDP suggest that, while the economy might encounter bumps in the road, the risk of a recession caused by sharp cutbacks in business investment and consumer cyclicals are currently modest.
Labor markets are still improving
Keep an eye on labor force participation by prime age workers. Continued slack indicates potential for further growth ahead.
The unemployment rate has long been one of the most reliable cyclical indicators. After spiking to 10% in 2009, the unemployment rate has slowly declined to 3.5%, a 50-year low, in September 2019. This has prompted some concerns that the economy will slow or stall due to the apparent lack of available workers.
Yet other indicators show that the labor markets continue to heal from the damage that occurred during the financial crisis. For example, the unemployment rate only measures those who are currently looking for work but not those who have stopped searching. The people who are no longer in the labor force include discouraged workers as well as those who have returned to school or are caring for children or parents.
To get a better picture of the availability of workers we can look at the labor force participation rate, which measures how many people are currently working or are actively looking for work. Labor force participation by prime age (25- to 54-year-old) workers was above 83% prior to the Great Recession. As job prospects dimmed during the crisis, participation declined to 82% by 2010. More surprising is that labor force participation continued falling for eight years after the recession began, to less than 81% in 2014 and 2015.
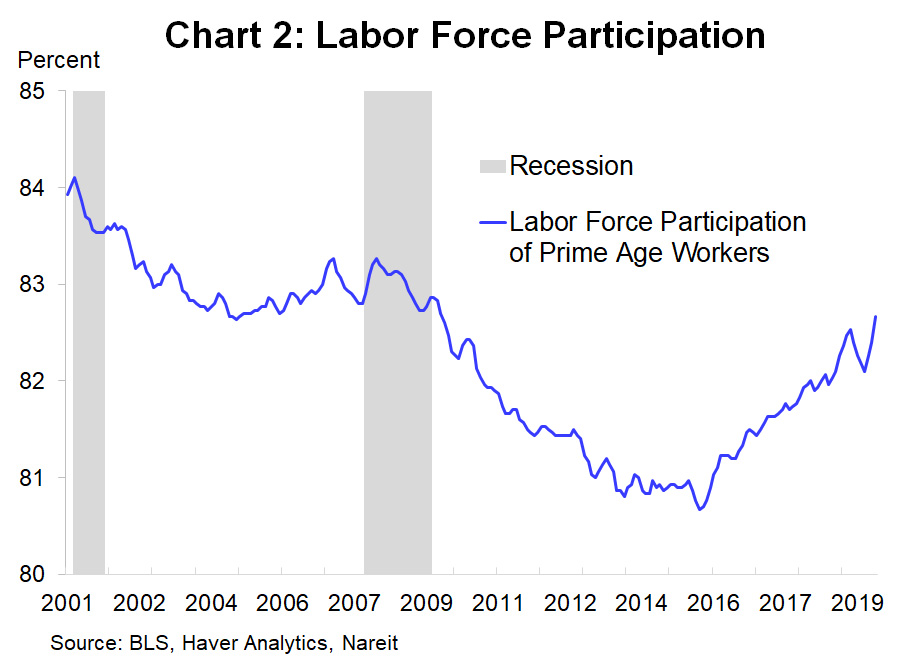
Labor force participation has rebounded over the past three years as tighter job markets have bolstered wages. Even so, the participation rate of prime-age workers has not fully recovered to levels seen in the past. During past business cycles, labor force participation had rebounded within a year or two of the end of the recession. The large increases in participation rates over the past three years (which are, paradoxically, typically an “early cycle” phenomenon) demonstrate that, at least in terms of the job market, the recovery is not as “old” as calendar time might suggest.
Homeownership sends a signal of confidence about household finances
Watch the homeownership rates among Millennials. Continued increases in 2020 and beyond may foretell other improvements in the economy and real estate markets.
Homeownership is a third marker for progress in today’s economy. The housing crisis caused homeownership rates to plunge from a record high near 70% before the Great Recession, to 63% in 2016, the lowest in 50 years. A weak housing market was a drag on the overall economy for several years after the recession ended.
In the past, homeownership rates recovered from recessions within the first year or two of the expansion. This time, again, was different, as homeownership continued to drop for eight years after the worst phase of the crisis. It is hardly surprising that homeownership continued falling, with waves of foreclosures, plus millions of Americans whose finances and credit scores were damaged by the crisis and others who were unsure whether the advantages of homeownership justified the financial risks.
The continued downward trend in homeownership long after the crisis ended raised concerns that a “renter nation” may not have the same stability or vitality that the country had experienced in the past. Millennials were not buying homes and it was feared they might never embrace homeownership to the degree their parents and grandparents had done. Homeownership and the related purchases of furniture and appliances make a significant contribution to GDP growth, and the prospect of a permanently lower homeownership rate dimmed the prospects for more robust economic growth in the future.
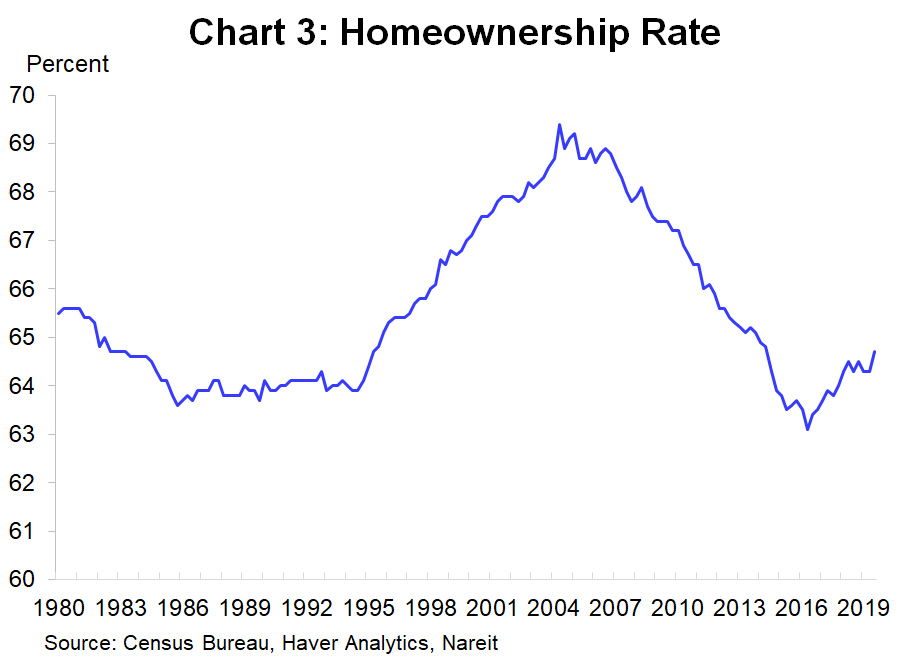
Homeownership rates have begun to recover, however, and have risen steadily over the past three years. It is notable that the rise in homeownership over the past three years has been driven primarily by younger age groups. The homeownership rate of households under age 35 has increased 340 basis points from its low point following the crisis, and the rate among households age 35 to 44 has increased 230 basis points. In contrast, the homeowner rate for 55- to 64-year-olds edged up 40 basis points, and other older groups rose 100 bps or less.
Homeownership generally rises in the early and middle stages of an economic expansion, and the more recent recovery reflects ongoing improvements in household financial positions and confidence in the future. Homeowners may help fuel future economic growth.
Low interest rates support economic growth
Be alert to possible rising interest rates. With moderate economic growth and inflation nowhere to be seen, though, interest rates are likely to remain in a favorable range in 2020.
The current interest rate environment is good for GDP growth. The Fed had been raising its target for short-term interest rates through 2018, and the yield on the 10-year Treasury note moved above 3% to reach 3.24% in November 2019, the highest since 2011. The Fed reversed course in 2019, however, and both short-term and long-term rates declined throughout the year.
Interest rates sparked worries in 2019 as long-term rates dipped below short rates, often described as an inverted yield curve. In past decades, this phenomenon nearly always foretold a coming recession. The yield curve typically inverted because the Federal Reserve was raising short-term rates in a deliberate attempt to slow an overheating economy. Often the Fed tapped the brakes a bit too firmly and the economy stalled in a recession.
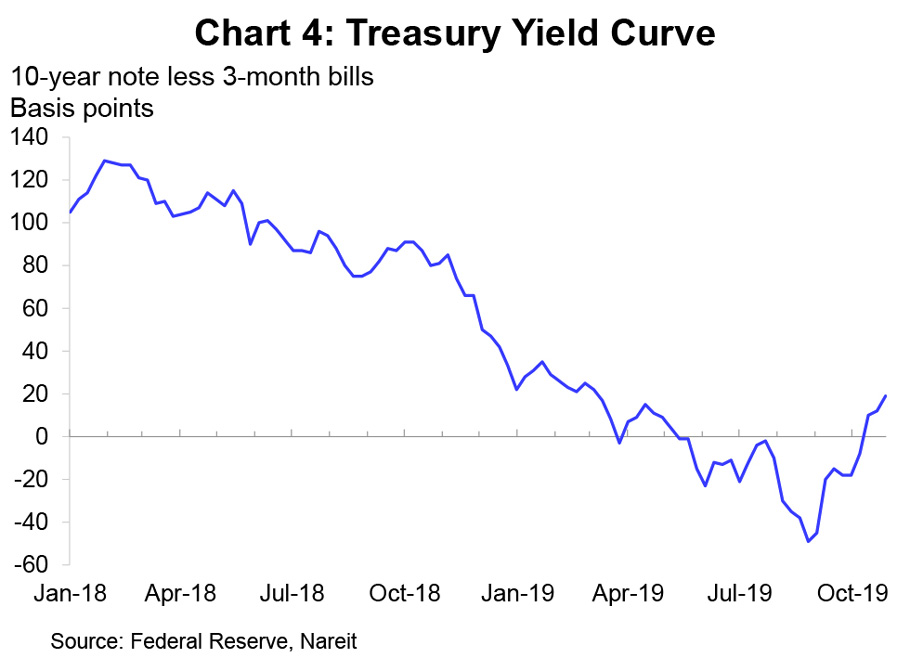
This time, however, the yield curve inverted from May through October, but then righted itself even as the economic environment firmed a bit. It was a decline in long-term rates, not a rise at the short end, that caused the most recent inversion. There are very different factors affecting today’s interest rate markets than in the past. In particular, the long end of the yield curve is held down by the trillions of dollars of long-term bonds that the Federal Reserve and other central banks purchased during the financial crisis as they attempted to give the economy additional monetary stimulus even as short rates were near zero. These securities are still on central bank balance sheets and are holding down long-term rates, making it easier for the yield curve to flatten and invert.
Commercial Real Estate Markets
“Mature” and “late cycle” are different concepts
A “mature” phase with construction in line with demand growth, and with property prices aligned with net operating income (NOI), can keep going. History has few examples of a mature real estate expansion with moderate risks to the economic fundamentals, as we have today. But keep an eye out for overbuilding, rising vacancy rates, or excessive price growth.
Commercial real estate is clearly in a mature phase. This is in contrast to the macro picture, where some measures indicate a mature phase of expansion while others resemble middle stages. During the initial recovery phase, demand for commercial real estate snapped back and exceeded new construction. Vacancy rates declined, rent growth accelerated, and property prices rose at a double-digit pace.
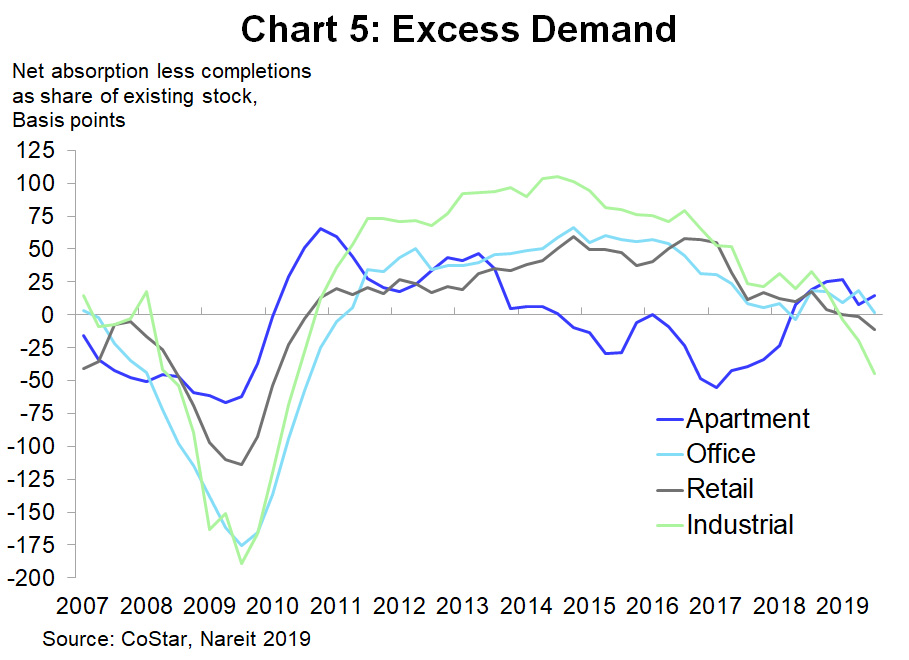
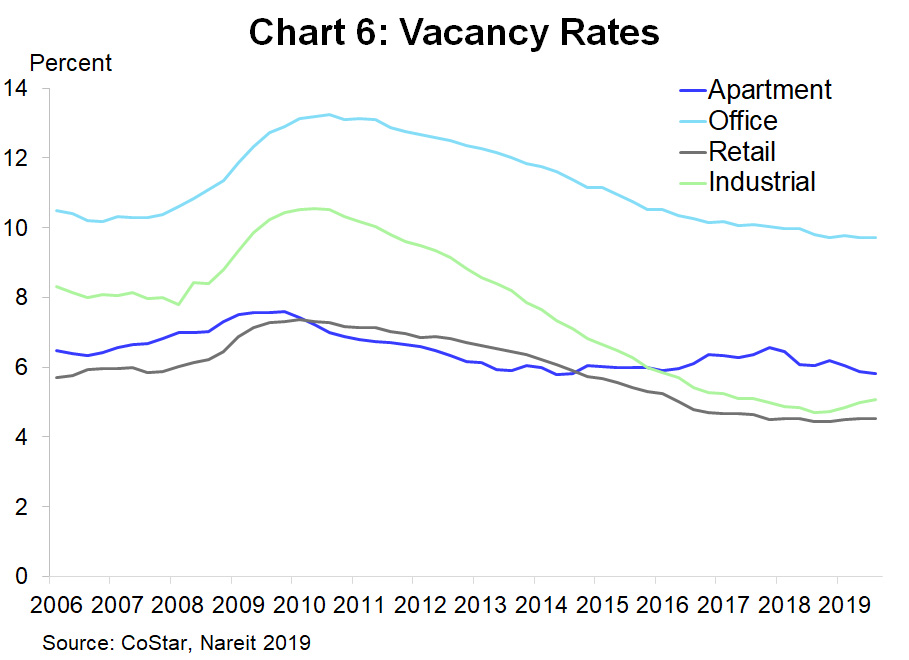
Commercial real estate has moved into a phase where supply and demand are in rough balance with little or no excess demand. Vacancy rates are low but are no longer declining; neither, however, are they increasing due to excess supply. Rent growth has slowed. Some of the slowing may be due to unsettled market conditions earlier in the year when there were widespread fears that a downturn was imminent in property markets.
This “mature” phase of the commercial real estate market should not be confused with “late cycle,” as late cycle risks look much different from what we are seeing today. The most prominent warning flag would be overbuilding. This happens when construction gets too far ahead of demand growth, vacancy rates move higher, and eventually rents and property prices stop rising and even decline.
A second major late cycle warning flag is speculative growth of property prices, where prices rise faster than NOI and cause cap rate compression. Property price increases in recent years have been matched by rising NOI and suggest solid support from fundamentals rather than speculative froth. It’s true that cap rates today are low, but so are interest rates. The cap rate spread to Treasury yields, which measures the return above risk-free rates to real estate investors, remains comfortable.
Internal and external risks to CRE markets
Risks to CRE markets may well originate outside of the sector. Keep an eye on the macro fundamentals discussed earlier and watch their impact on demand for real estate.
Most commercial real estate downturns have occurred when a macroeconomic shock hit CRE markets that had excesses of their own. For example, there was a high and rising level of commercial construction in the year or two ahead of the Great Recession. While there were not as many speculative excesses in CRE as in single family housing and the home mortgage market, commercial real estate was in an exposed position when the recession caused demand to plunge.
Similarly, commercial construction was elevated during the dot-com boom in the late 1990s, which amplified the impact of the 2001 recession on CRE markets. And the list goes on… during the 1980s, a massive boom in office construction made the sector quite vulnerable to the recession and banking crisis at the end of the decade.
In every real estate cycle in recent decades, CRE markets spent only a limited time in a mature phase like today before being jolted by a macroeconomic shock. That is, there were internal risks in the CRE markets, including excess construction and speculative pricing, at the same time the markets were hit by external risks from a recession that had its roots outside of commercial real estate. The recessions of 1991, 2001, and 2008 each caused a sharp drop in demand for commercial real estate, and rising vacancies, falling rents and falling prices.
There has not been a similar situation in recent decades, where CRE markets were in a mature phase like today, with high levels of construction that were matched by growing demand, but the macroeconomy still exhibited a mix of middle and mature stages. History warns that not only is a future downturn eventually going to occur, but also it often originates in an unexpected area. The challenge will be to keep an eye on both internal risks that may build up and also external risks of an overheating macro economy.
REITs
The outlook for REITs in 2020 remains favorable. We expect modest economic growth and see few signs of recession on the horizon. Real estate markets enjoy low vacancy rates and a balance of new supply and growing demand, supporting rent growth and REIT earnings in the year ahead. Watch out, however, for rising vacancies or slowing rent growth.
Stock market performance rebounded in 2019
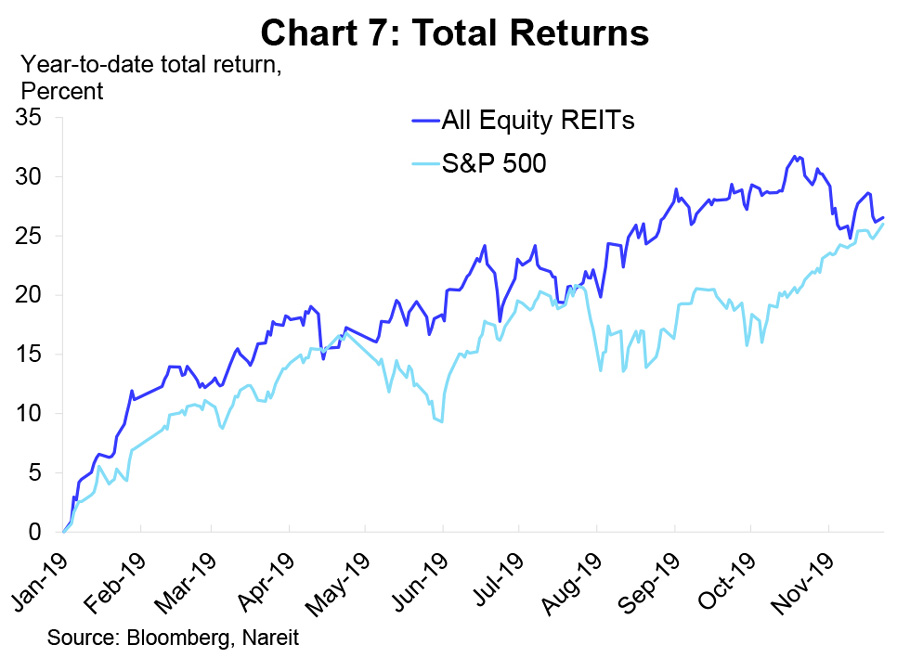
In 2019, REITs posted the best investment performance since 2014, based on resilient economic fundamentals and an improved outlook for real estate. REITs delivered a total return of 27.9% through the first 11 months of 2019, according to the FTSE Nareit All Equity REITs Index. Nearly all property sectors delivered double-digit returns over that time period, led by Industrial REITs (52.4%), Data Centers (41.1%), Timber REITs (36.9%) and Residential REITs (35.5%).
Investing in REITs reduced risks in a diversified portfolio in 2019. Investment analysts frequently discuss the importance of diversification to lower the volatility of investment returns, and REITs are an essential part of many strategies. In 2019, REIT investors enjoyed a clear benefit from diversification as REITs provided a safe harbor from the trade wars and their impact on multinational corporations and firms that rely on export markets.
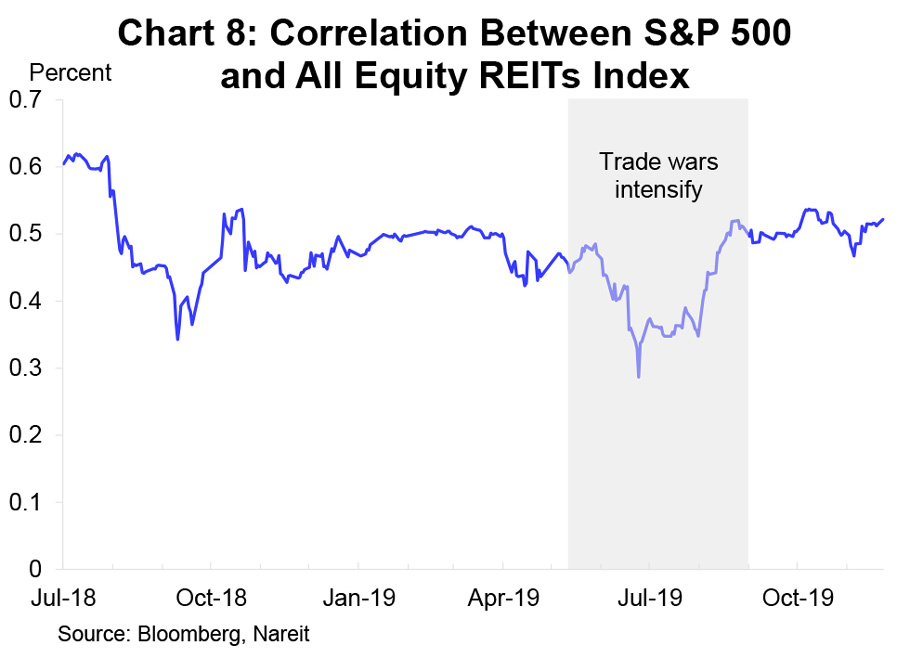
With their domestic focus, REIT share prices were little impacted by trade wars. The correlation between REITs and broad equity market indices plunged as the trade wars intensified in May 2019, falling below 30%, compared to an average above 50% in recent years.
The current market environment is favorable for REIT operating performance
REITs perform well when the economy is growing and vacancy rates are low. This was the case in 2019, and the outlook for 2020 remains favorable.
U.S. equity REITs reported total funds from operations (FFO) of $15.8 billion in the third quarter of 2019, according to the Nareit T-Tracker®, a comprehensive report on operating performance of the U.S. listed REIT industry. Earnings growth has slowed, however, with FFO for the first three quarters of 2019 at $48.2 billion, unchanged from the first three quarters of 2018. FFO in the first three quarters of 2018 had been 8.0% higher than the year before.
There have been widespread increases in earnings across the REIT sector, as two-thirds of REITs reported higher FFO in the third quarter of 2019 than a year ago, the highest proportion since the fourth quarter of 2016.
Acquisitions and improved cost of capital anticipate upside potential for REITs
Acquisition activity picked up in 2019, reflecting improved cost of capital and optimism about future returns in real estate. REITs are likely to continue to access the equity markets to increase their holdings of income-producing properties in 2020.
A lull in net acquisitions in recent years had contributed to slower growth of FFO. Net acquisitions averaged $52.0 billion per year from 2011 through 2015; these timely acquisitions have served REIT investors well, as property prices rose 49.5% from 2011 to 2015, according to CoStar. Net acquisitions slowed, however, as the share price premium to NAV declined and turned to a discount for many REITs, raising their cost of capital. Net acquisitions averaged $16.6 billion per year in 2016 and 2017 and were slightly negative in 2018.
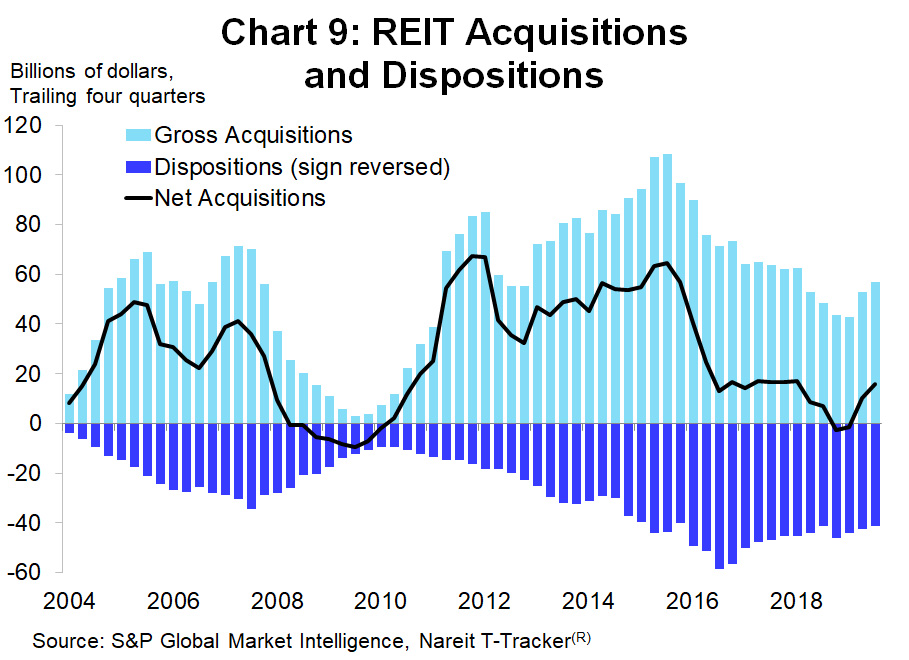
The strong stock price performance of the REIT sector in 2019 has resulted in a price premium to NAV for many REITs. Net acquisitions have rebounded, to $18.8 billion in the first 11 months of 2019, the strongest performance since 2015.
Rising net acquisitions will boost FFO growth over the coming quarters and years and reflect growing confidence by REIT management and investors in the prospects for the REIT industry.
Operating fundamentals are poised for growth
There is robust demand for space in REIT-owned properties, which has kept the occupancy rate of all REIT-owned properties near the record high reached in 2018. These high occupancy rates support rent growth and will likely contribute to higher FFO in 2020.
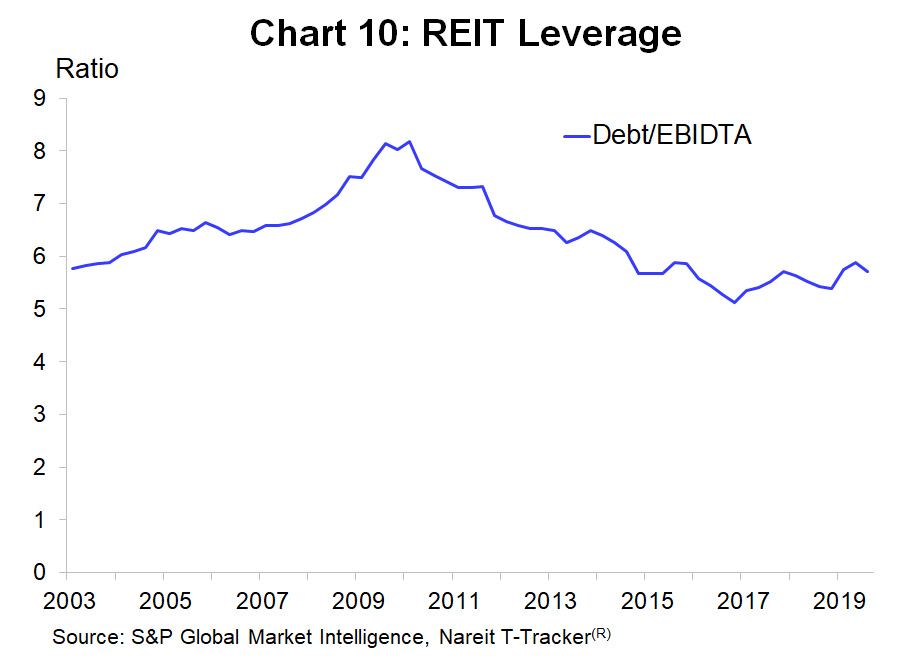
REIT balance sheets are well positioned to support future operations. REITs have lowered their leverage by raising significant amounts of equity capital to finance their property portfolios. The aggregate debt/EBITDA ratio across all equity REITs was 5.7x in 2019, compared to 7x to 8x in 2007-2008. Lower leverage can help in any type of environment, providing dry powder for future acquisitions if market conditions remain positive, while also providing a cushion against either higher interest rates or a rocky economic environment.