Nareit tracks quarterly investment holdings for the 27 largest actively managed real estate investment funds focusing on REIT investment for insight on expert investor sentiment.
In the second quarter of 2023, active managers increased allocations by over one percentage point in the health care and residential property sectors and by almost one percentage point for data centers. All three sectors’ shares were up year over year as well in the second quarter. All three were also overweight in their share of fund assets under management compared to their share of the FTSE Nareit All Equity REITs Index.
In terms of returns, active managers increased their share of data centers and specialty at the beginning of 2023, and those two sectors outperformed the All Equity index in the second quarter. For the three sectors that active managers have increased from the previous year, year over year for the second quarter, data centers has outperformed by more than 14 percentage points, residential has underperformed by nearly 1.5 percentage points, and health care has underperformed by over 2 percentage points.
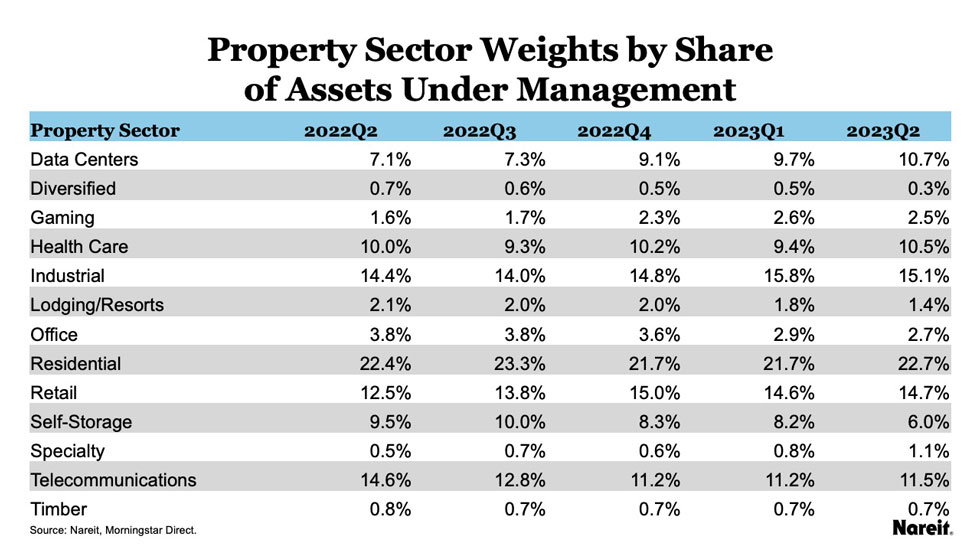
The table shows the share of each equity REIT property sector in all 27 funds by assets under management.
- Traditional sectors maintain a strong share of assets, with residential at the highest share of assets at 23% in 2023Q2 and retail and industrial at 15%. However, office is down to 3%.
- Infrastructure, data centers, and health care each have more than a 10% share of assets.
- Diversified and timber have less than a 1% share, and specialty and lodging/resorts have less than a 2% share.
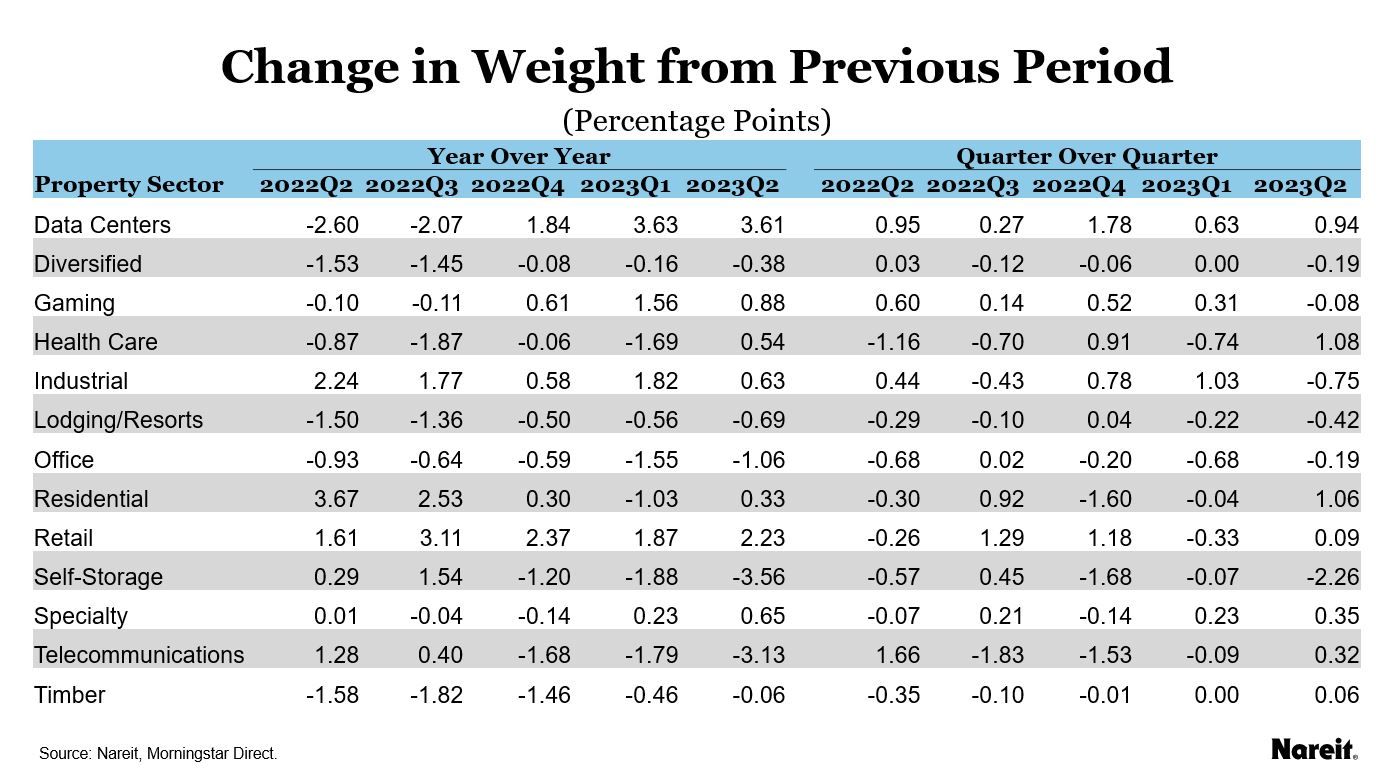
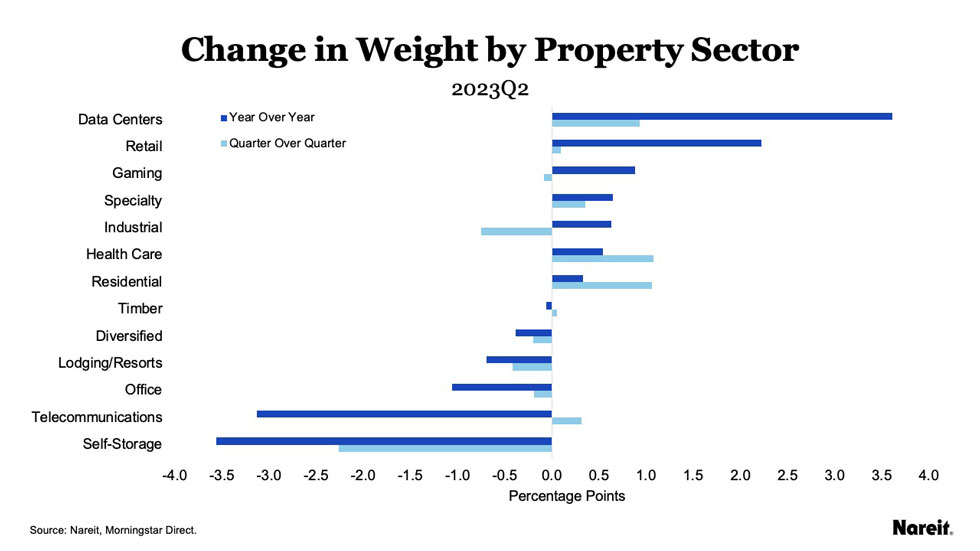
The table and chart show the change in property sector asset share by quarter and from the previous year.
- Data centers has the biggest increase from last quarter, up 3.6 percentage points, but only up one percentage point from second quarter last year.
- Retail, health care, residential, and specialty are all up for the quarter by less than one percentage point and also up from the previous year.
- Diversified, lodging/resorts, office, and self-storage are all down for the quarter and down for the year.
- Infrastructure is down for the year, but up 0.3 percentage points for the quarter.
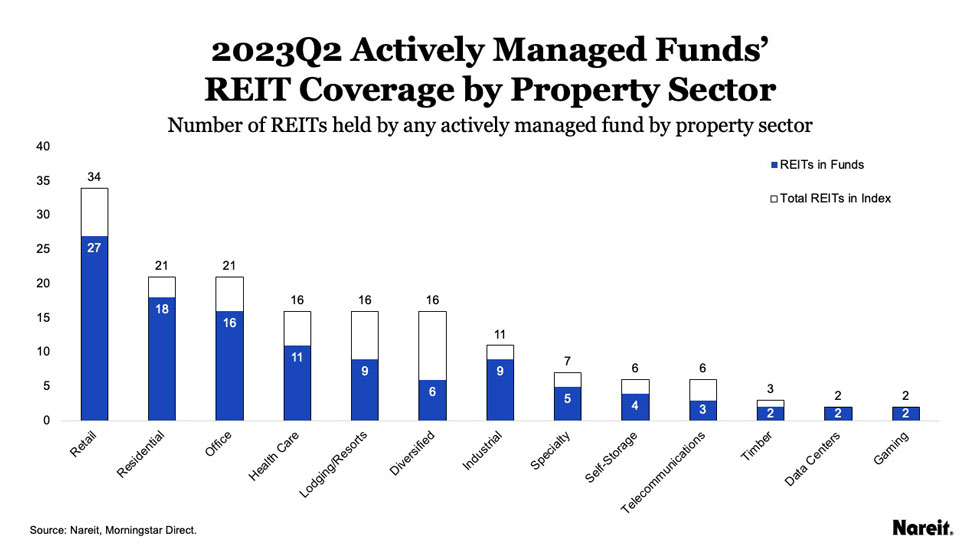
The chart shows the number of total REITs in that sector (as designated by the FTSE Nareit All Equity REITs Index) that are present in at least one of the actively managed funds.
- Both data center REITs and gaming REITs are in all the funds.
- Retail, office, and residential have the most REITs in their sectors, and have relatively high coverage.
- Of the 34 retail REITs, 27 are in funds.
- Of the 21 residential and office REITs, 18 residential REITs and 16 office REITs are in funds. No residential REIT is in every fund.
- Diversified REITs have the least coverage with 16 different REITs total and less than half of them in funds.
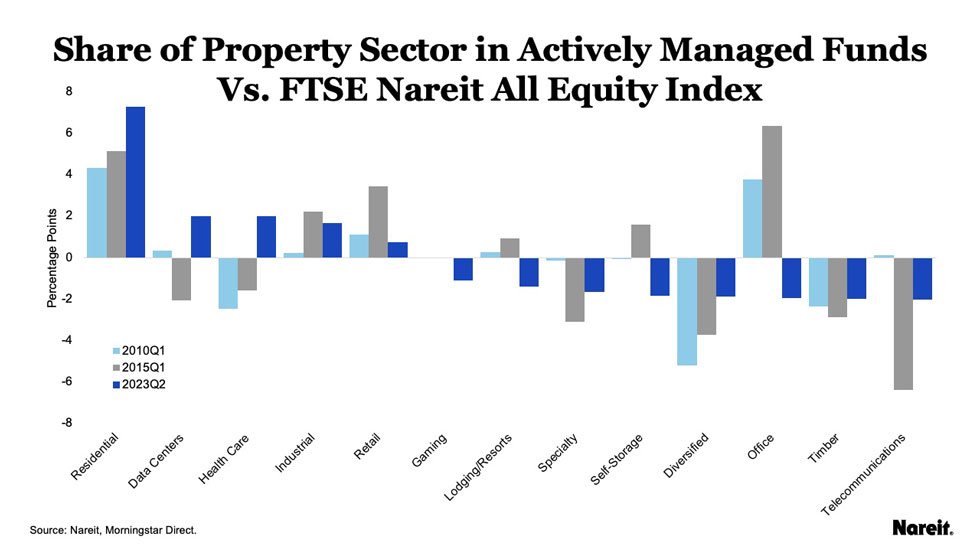
The chart compares the weight of the sectors in actively managed funds to the weight of the sectors in the All Equity Index.
- Residential remains strongly overweighted in the funds compared to the index. The overweight is at its highest point in 2023Q2, greater than 7 percentage points higher than its share in the index.
- Traditional sectors of retail and industrial have stayed consistently overweighted in the funds. Industrial is overweight by almost two percentage points and retail is overweight by almost one percentage point in 2023Q2.
- Office and lodging/resorts were overweighted before the pandemic, but since have been persistently underweighted by the funds. Office is underweight by 2 percentage points, and lodging/resorts is underweight by more than one percentage point.
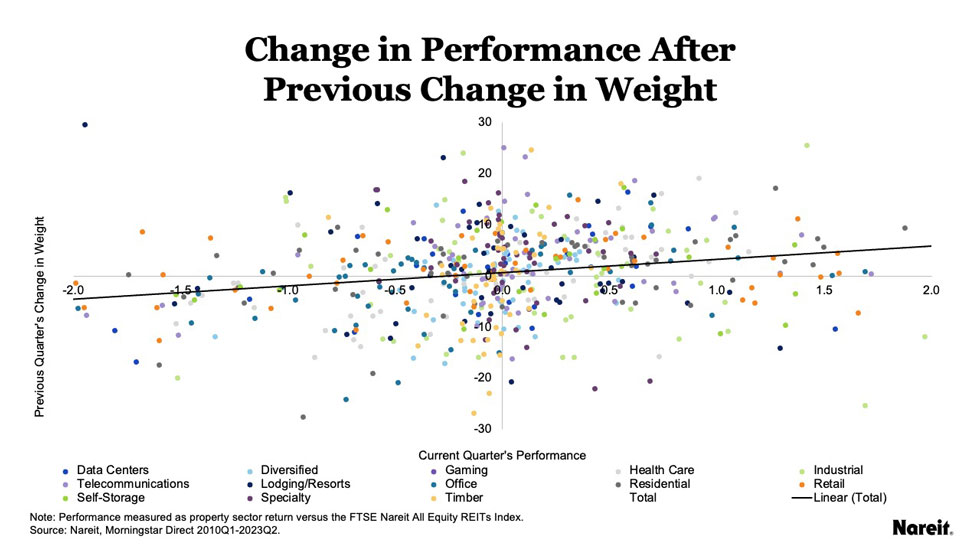
The chart shows quarterly changes in the funds’ weight plotted against the performance of each sector in the next quarter, measured as the percentage point difference between the sector quarterly return and the All Equity quarterly return. Overall, a one basis point increase (decrease) in a property sector’s weight is associated with a statistically significant 3 basis points of outperformance (underperformance) by that property sector over the All Equity Index in the next quarter. Active managers did a mixed job predicting return performance for the second quarter.
- Active managers decreased infrastructure, self-storage, and lodging/resorts weights in the first quarter of 2023 and the sectors subsequently underperformed the index in the second quarter.
- Specialty and data centers saw an increase in fund weight in the first quarter and outperformed the index in the second quarter.
- The remaining sectors show the same positive correlation.
For more information on the active manager project, please see this recent Nareit Market Commentary: Reading the Real Estate Market: Tracking Active Managers’ Allocations Over Time.