Nareit tracks quarterly investment holdings for the 26 largest actively managed real estate investment funds focusing on REIT investment for insights into expert investor sentiment. In the third quarter of 2024, active managers continued to shift allocations to digital and health care sectors.
Data centers and telecommunications are now the most overweight sectors relative to their index weight, invested at 130% and 123% of their index shares respectively. Telecommunications had the largest year-over-year increase for the second consecutive quarter, up 3.3 percentage points. Timberland and self-storage were also up, both year-over-year and quarter-over-quarter, while retail, industrial, and residential were all down year-over-year and quarter-over-quarter.
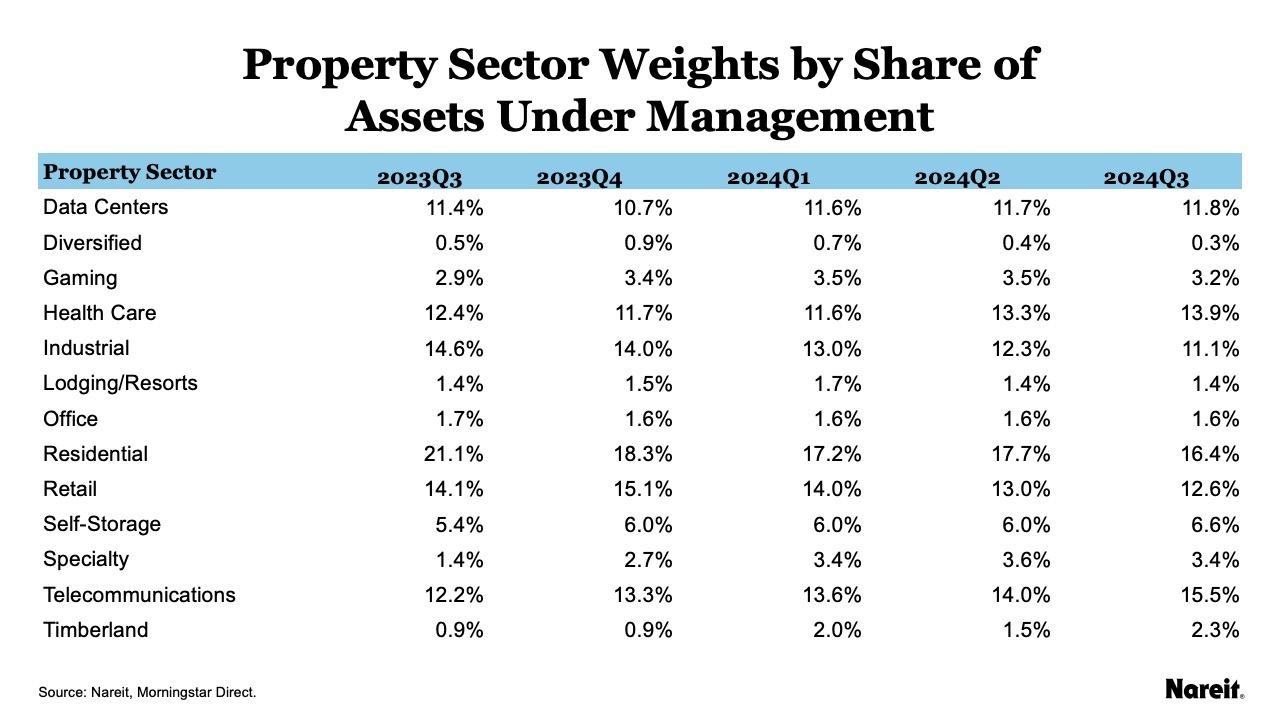
The table above shows the share of each equity REIT property sector by assets under management.
- Residential remains the property sector with the highest investment at 16.4%, followed by telecommunications at 15.5%—but that gap is closing.
- Health care has the third highest allocation at 13.9% after moving into third place last quarter.
- Industrial (11.1%) has dropped to sixth place, with retail (12.6%) and data centers (11.8%) in fourth and fifth places respectively.
- Office and lodging/resorts are both less than 2%, with diversified less than 0.5%.
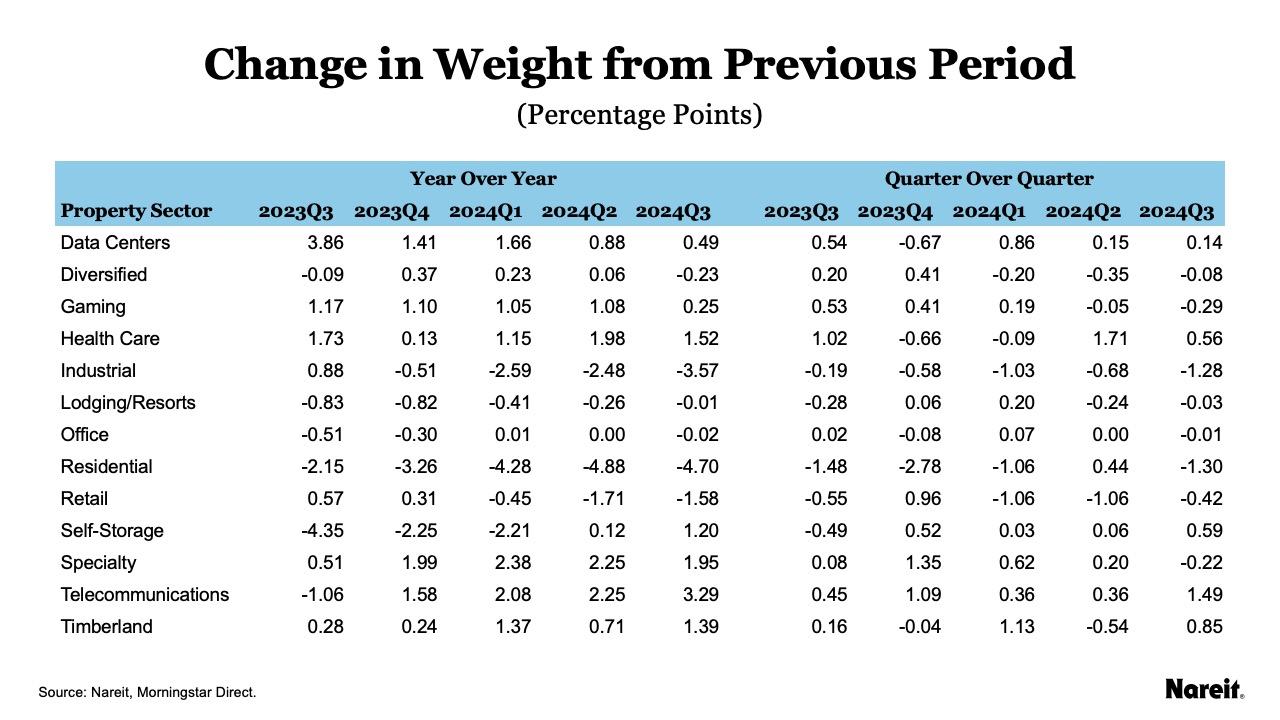
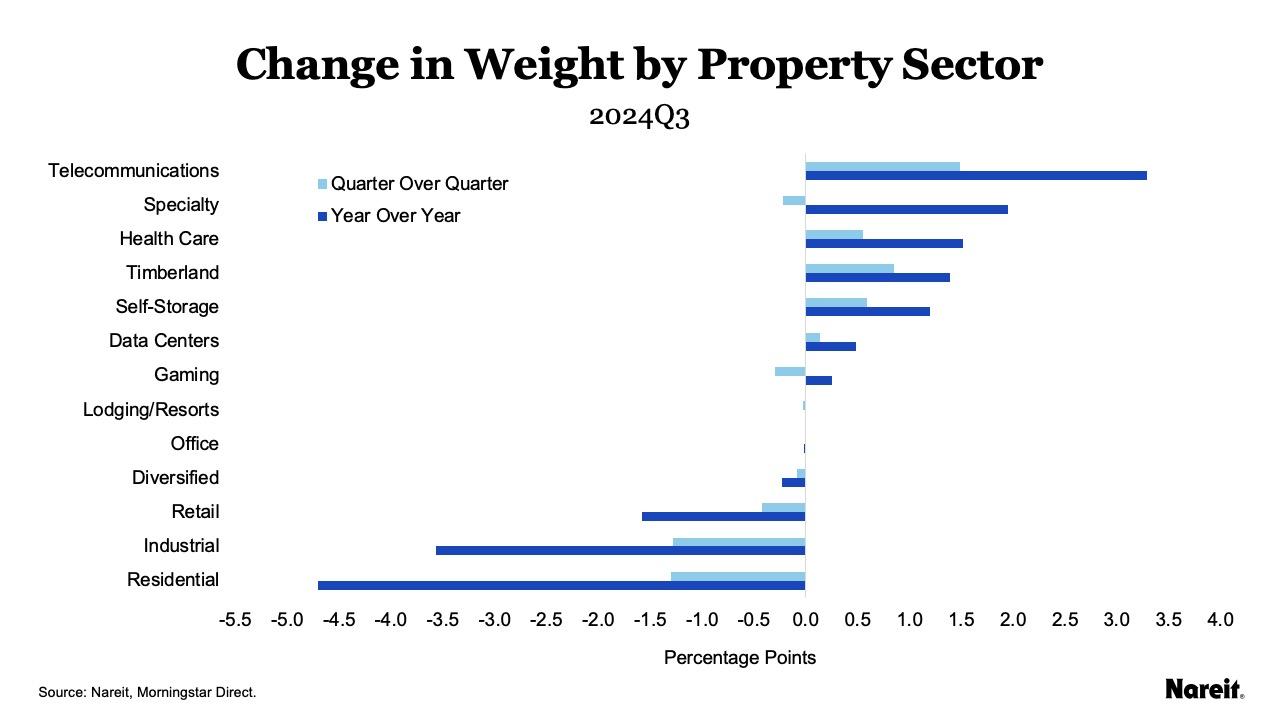
The table and chart above show the change in property sector asset share by quarter and from the previous year.
- Telecommunications had the highest year-over-year gain in weight for the second consecutive quarter in Q3 2024. The sector was up 3.3 percentage points year-over-year in the third quarter. The quarterly gain of 1.49 percentage points was also the highest.
- Specialty had the second highest year-over-year gain at 1.9 percentage points despite falling 0.2 percentage points from the previous quarter.
- Health care, timberland, and self-storage were all up, both year-over-year and quarter-over-quarter. The sectors all increased year-over-year by more than a percentage point with quarterly gains over half a percentage point.
Residential, industrial, retail, and office were all down in the third quarter and for the year.
- Residential was down 4.7 percentage points from the previous year in the third quarter.
The sector also experienced quarterly decreases in every quarter over the past year except for last quarter. - Industrial has seen quarterly decreases every quarter for the past year and was down 3.6 percentage points from the previous year in the third quarter.
- Retail had quarterly decreases over a percentage point in the first two quarters in 2024, with only a modest decline of 0.4 percentage points in the third quarter. The sector is down 1.6 percentage points for the year.\
- Office has very little room for large cuts at only a 1.6% share of total assets, but was down 0.01 percentage points in the third quarter.
Funds are strongly overweight in digital sectors for Q3 2024.
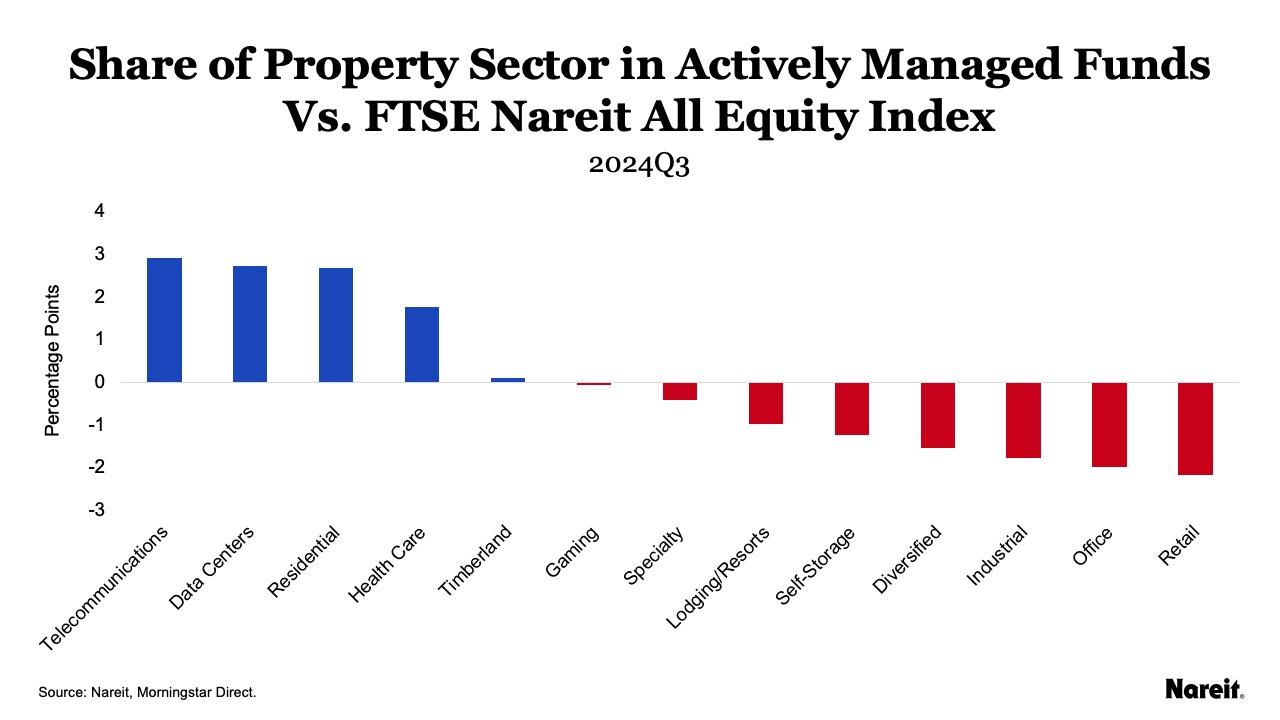
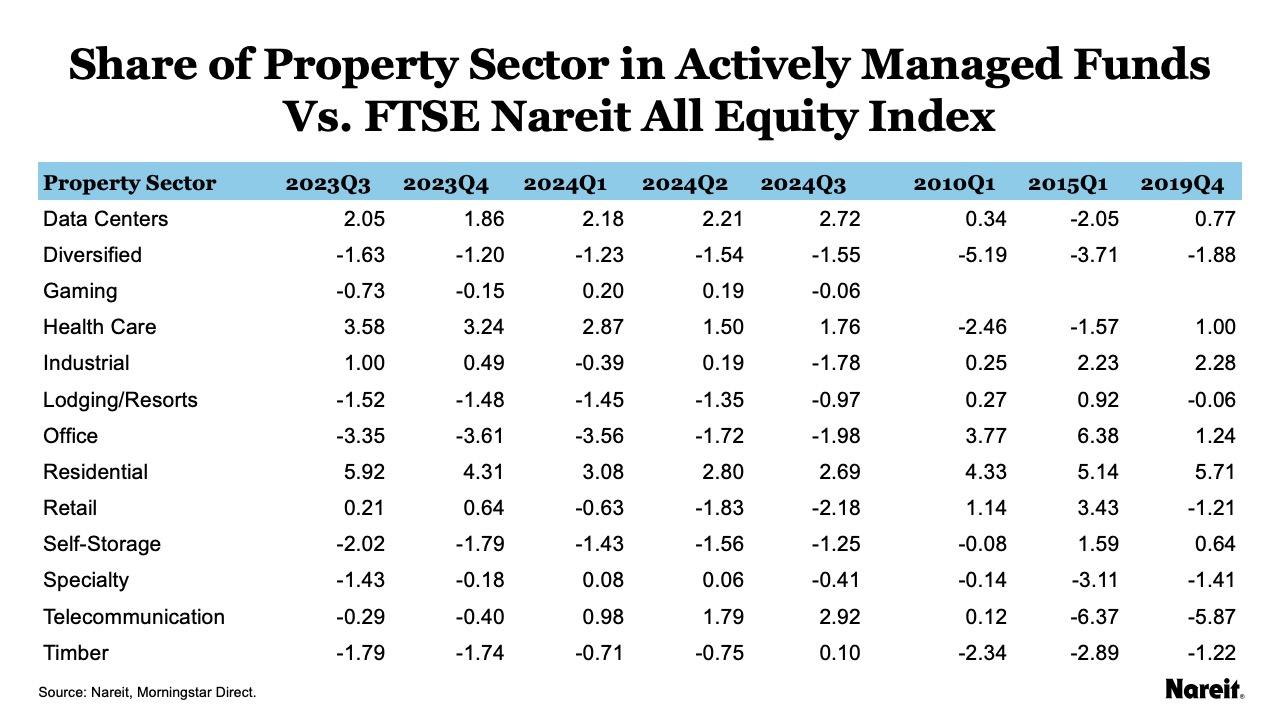
The chart and table above compare the weight of the sectors in actively managed funds to the weight of the sectors in the FTSE Nareit All Equity index (All Equity Index). The chart shows the percentage point difference in each sector’s weight in the actively managed funds relative to their weights in the index. The table shows historical quarterly percentage point differences for the past year and historically on the right.
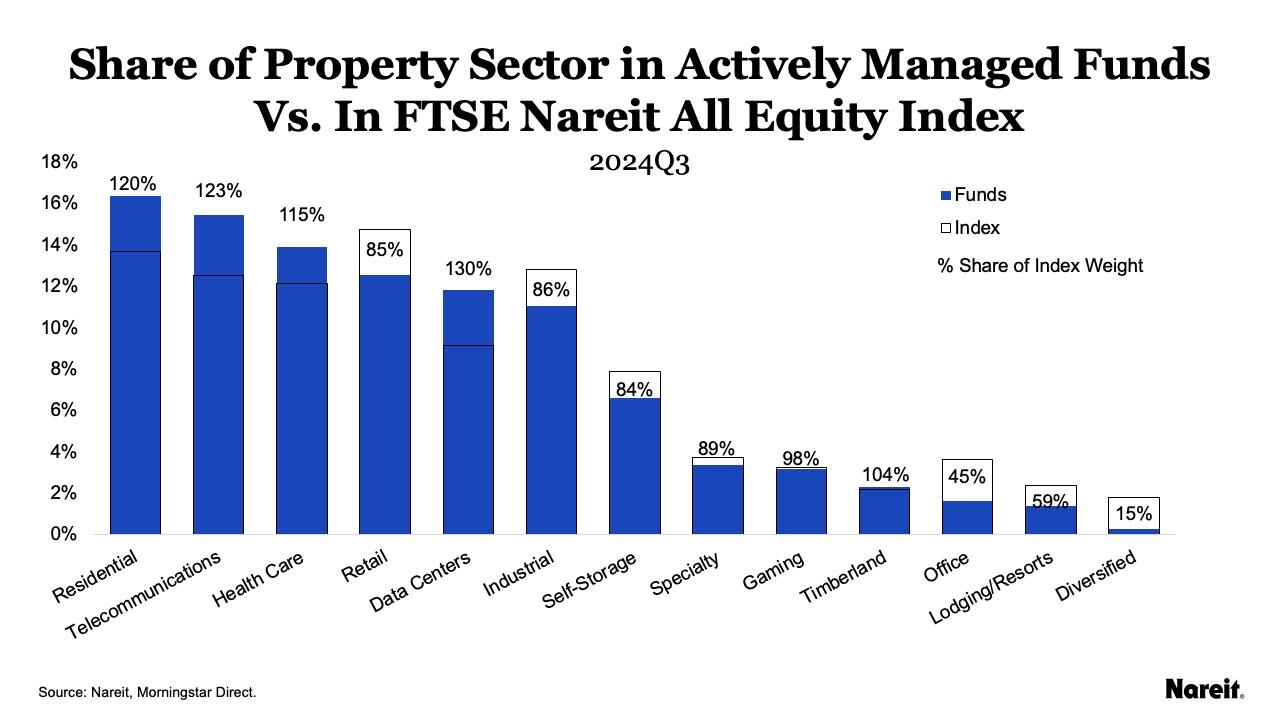
The chart above shows property sector weights relative to their index weights. The blue bars show the weight in the actively managed funds, and the black outlined bars show the weight in the index. The numbers represent the fund holding as a share of index weight, so sectors that are overweight are over 100% and sectors that are underweight are under 100%.
Notably, this chart shows that when active fund managers make shifts in their allocations, small differences in percentage points can sometimes have more of an outside impact on that sector’s relative index weight than large shifts for sectors that have higher allocations. For example:
- Telecommunications is 12.5% of the All Equity index, representing 100% of its share of the index. In Q3, active fund managers overweighted their allocations by 2.9 percentage points, which put it at 123% of its share of the index.
- Data Centers is 9.1% of the All Equity Index, representing 100% of its share of the index. In Q3, active fund managers overweighted their allocations to data centers by 2.7 percentage points, which put it at 130% of its share of the index.
Other findings from this analysis include:
- Health care’s share of its index weight translates to it being overweight by 115%, or 1.8 percentage points.
- Residential’s large overweight in the funds has been steadily decreasing, going from 5.9 percentage points overweight in Q3 2023 down to 2.7 percentage points overweight in Q3 2024. Funds are invested at 120% of the index weight in residential.
- Industrial flipped strongly underweight in the third quarter at 86% of its index weight. The sector is underweight by 1.8 percentage points.
- Retail’s share continued to drop in Q3 2024 down to 2.2 percentage points underweight, the most underweight sector by percentage points. However, the sector is at 85% of index share, close to the underweight share of industrial, self-storage, and specialty.
- Industrial is 12.8% of the All Equity Index, representing 100% of its share of the index. In Q3, active fund managers underweighted their allocations by 1.8 percentage points, which put it at 86% of its share of the index.
- Lodging/resorts is underweight at 59% of its index share, but has gained ground over the past few quarters, moving from 1.5 percentage points underweight in Q3 2023 to just under one percentage point underweight in Q3 2024.
- Office and Diversified are the most underweight sectors. Diversified is the most underweight sector with just 15% of its index share, or 1.6 percentage points underweight. Office is at only 45% of its index share, or nearly two percentage points underweight.
Note that six funds had not reported third quarter data for this analysis.
For more information on the active manager project, see Reading the Real Estate Market: Tracking Active Managers’ Allocations Over Time.