In today’s economy, the pace of inflation has moderated, economic growth has remained healthy, the unemployment rate has held steady, the prospects of recession have lessened, and expectations for continued monetary policy easing have proliferated. The Federal Reserve appears to be well-positioned to successfully engineer a soft landing for the U.S. economy. In this environment, enthusiasm for commercial real estate (CRE) investment has grown. While lower financing rates and an expected closing of the public-private valuation gap bode well for reviving property transactions, the CRE market continues to be marked by supply-demand imbalances.
CoStar Data Illustrates CRE Occupancy Trends
CoStar data are typically viewed as broad indicators of the state of the U.S. CRE market. Occupancy rates and rent growth rates highlight property market fundamentals. Its occupancy rate data show generally waning fundamentals across the four traditional property types: retail, apartments, industrial, and office.
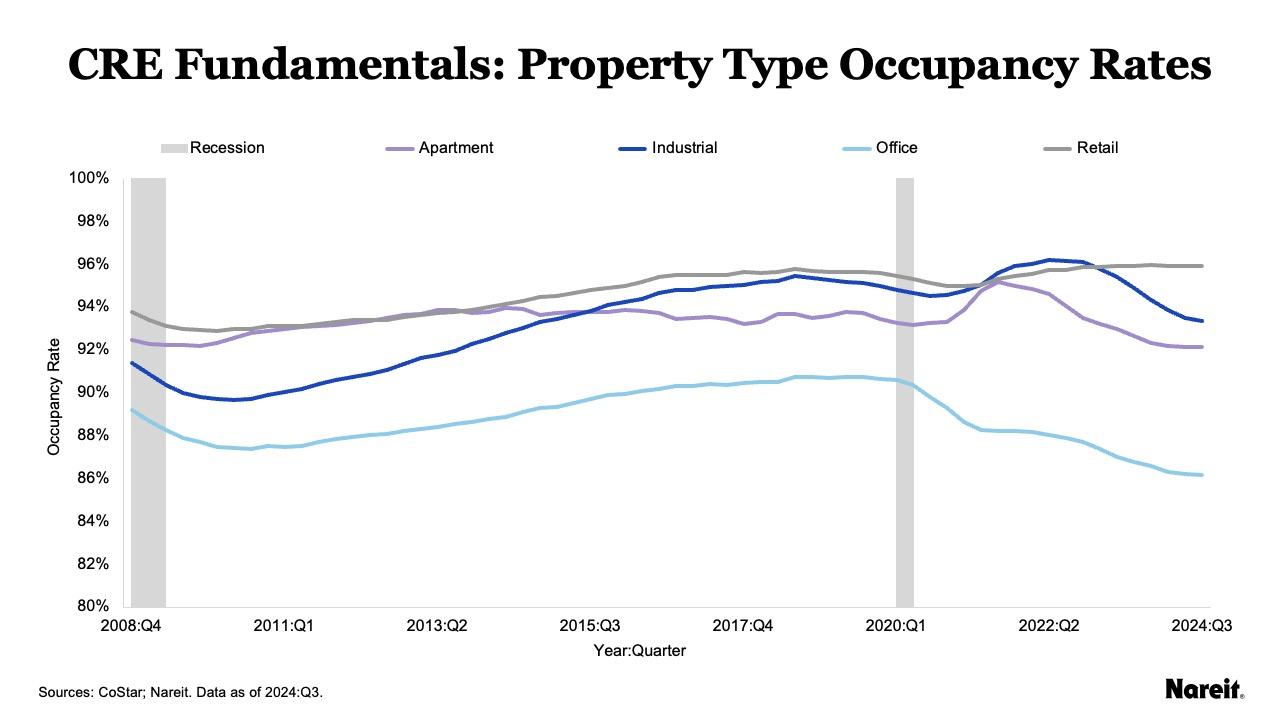
The chart above displays quarterly occupancy rates for the four traditional property types from the fourth quarter of 2008 to the third quarter of 2024, as well as U.S. recessions. In recent years, the retail sector has enjoyed a rising occupancy rate, but it appears to have plateaued. In contrast, occupancy rates for the apartment and industrial sectors have dropped off in the face of record amounts of new supply following record rent growth in the past few years. Office occupancy reflects a shifting and uncertain demand environment with the advent of more widespread remote work along with continued supply.
As of the third quarter of 2024, CoStar occupancy rates for the retail, industrial, apartment, and office sectors were 95.9%, 93.4%, 92.1%, and 86.1%, respectively. Preliminary data from Nareit’s quarterly performance tracker, which focuses on U.S. public equity REITs, offers a more positive picture. Occupancy rates across each of the four traditional property types were higher than their CoStar counterparts. Retail, industrial, and apartment occupancies all exceeded 95%.
Tallying the number of the largest 50 markets by asset values within each property type with rising or falling year-over-year occupancy rates within a particular quarter provides a gauge of momentum with respect to fundamentals. Increasing (decreasing) numbers of rising occupancy markets through time highlight positive (negative) momentum.
Sector Focus: Retail
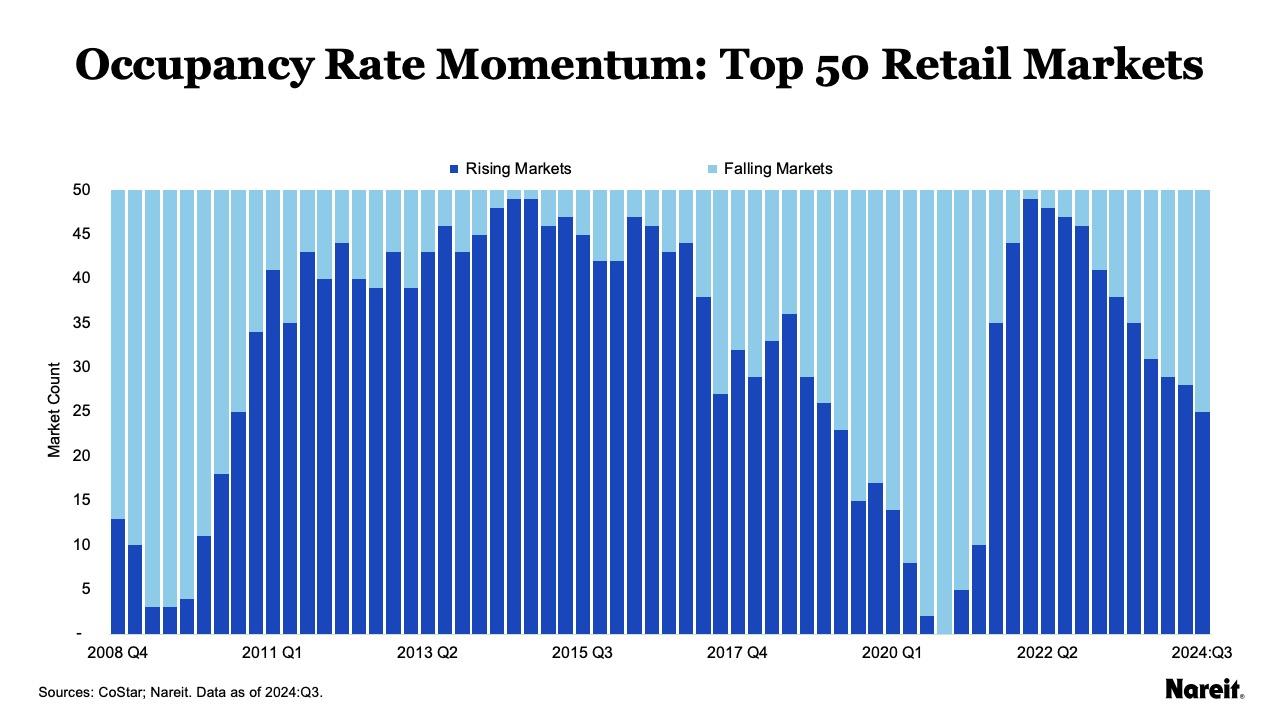
The chart above presents the number of markets that had rising or falling year-over-year occupancy rates for the largest 50 retail markets by property asset values from the fourth quarter of 2008 to the third quarter of 2024. The number of retail markets with rising year-over-year occupancy rates peaked at 49 markets in the first quarter of 2022. Since that time, the number of rising markets has been consistently declining. This has resulted in a leveling of the sector’s overall occupancy rate.
As of the third quarter of 2024:
- Twenty-five of the top 50 retail markets had increasing occupancy rates; 25 markets had declining rates.
- Average occupancy rates for rising and falling retail markets were 96.4% and 95.5%, respectively.
Although the sector appears to be healthy, the generally waning strength of occupancy rate momentum likely portends a softening of retail fundamentals.
Sector Focus: Apartments
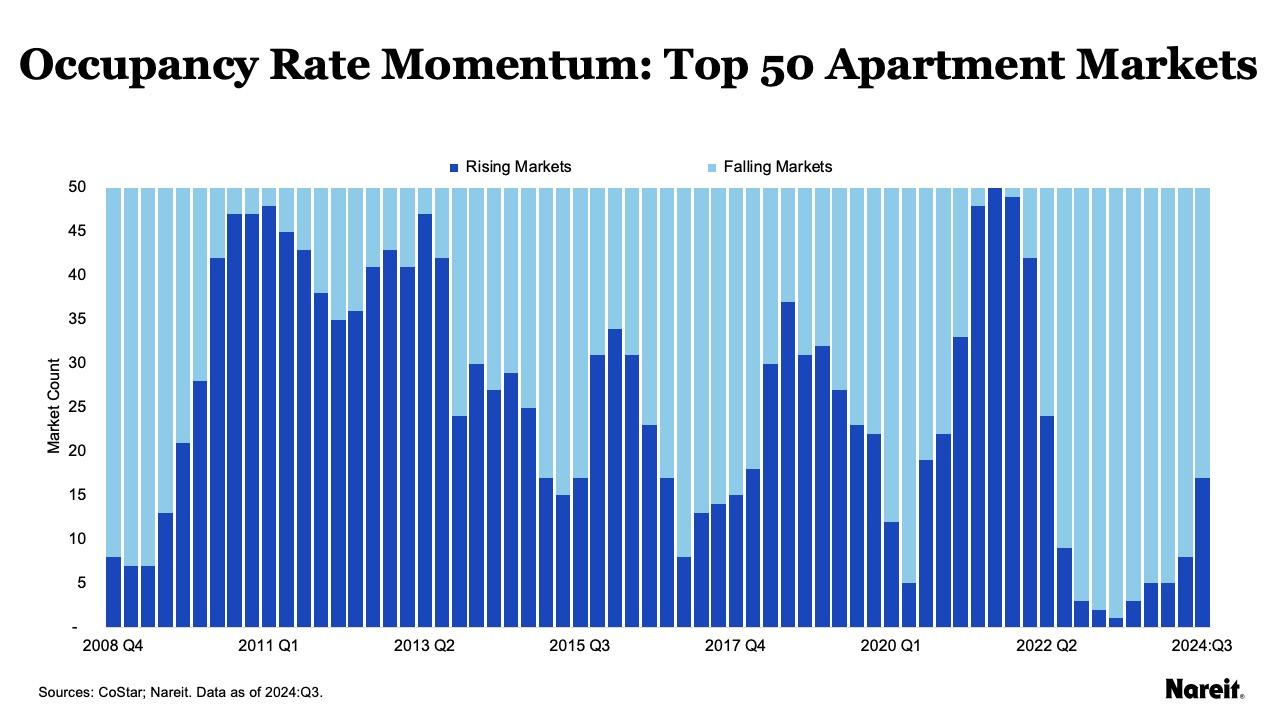
The chart above shows the number of markets that had rising or falling year-over-year occupancy rates for the largest 50 apartment markets by asset values from the fourth quarter of 2008 to the third quarter of 2024. The apartment sector experienced a dramatic drop in top 50 markets with rising occupancy rates in 2022. In the third quarter of 2021, all 50 markets had increasing rates; just one market posted a gain seven quarters later.
As of the third quarter of 2024:
- Seventeen apartment markets had increasing occupancy rates; 33 markets had declining rates.
- Average occupancy rates for rising and falling markets were 93.0% and 91.2%, respectively.
After hitting bottom in the second quarter of 2023, the apartment sector has started its recovery, and positive momentum is gaining traction. The sector is expected to slowly regain an upward trajectory in its overall occupancy rate as the industry works through record levels of supply that has come online in some geographies.
Sector Focus: Industrial
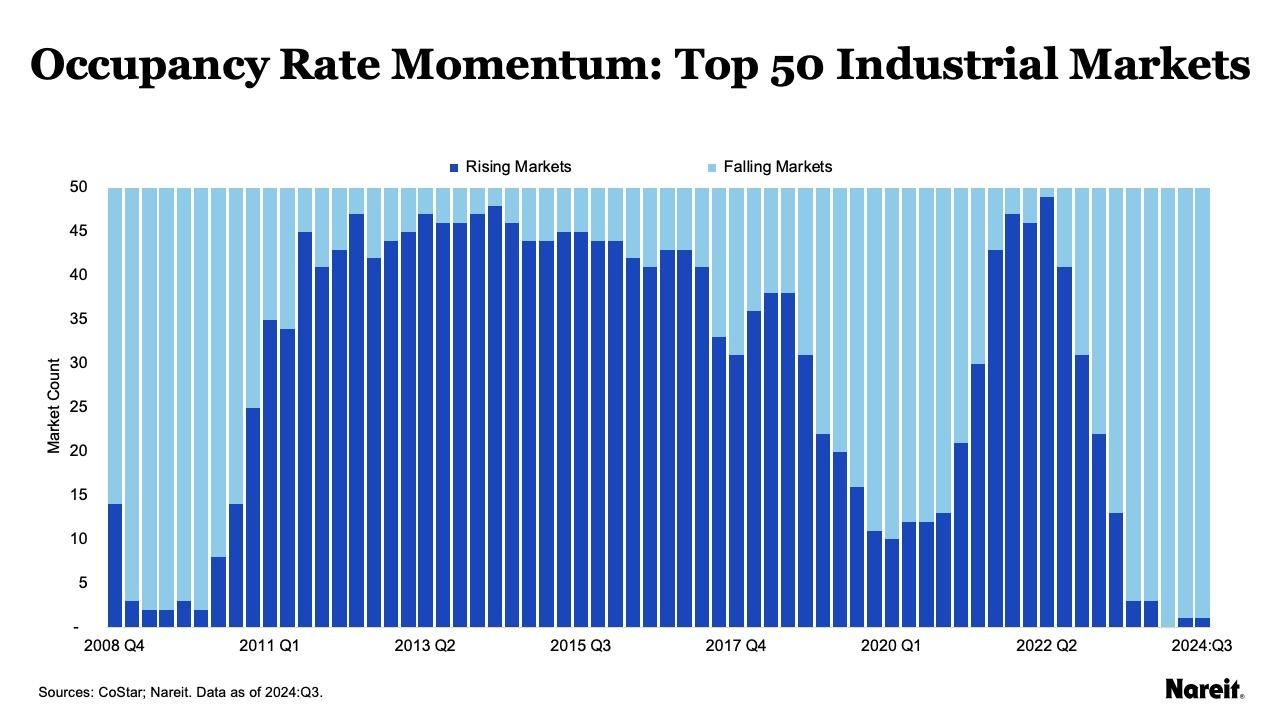
The chart above exhibits the number of markets that had rising or falling year-over-year occupancy rates for the top 50 industrial markets from the fourth quarter of 2008 to the third quarter of 2024. Similar to apartments, the number of industrial markets with rising occupancy rates plunged in recent years. In the second quarter of 2022, 49 industrial markets had increasing occupancy rates; no markets posted a gain by the first quarter of 2024.
As of the third quarter of 2024:
- Just one industrial market had an increasing occupancy rate; 49 markets had declining rates.
- Average occupancy rates for rising and falling industrial markets were 95.8% and 93.2%, respectively.
Positive occupancy rate momentum is clearly in a trough as supply-demand imbalances continue to temper industrial fundamentals. The industrial recovery will depend on the timing of demand growth.
Sector Focus: Office
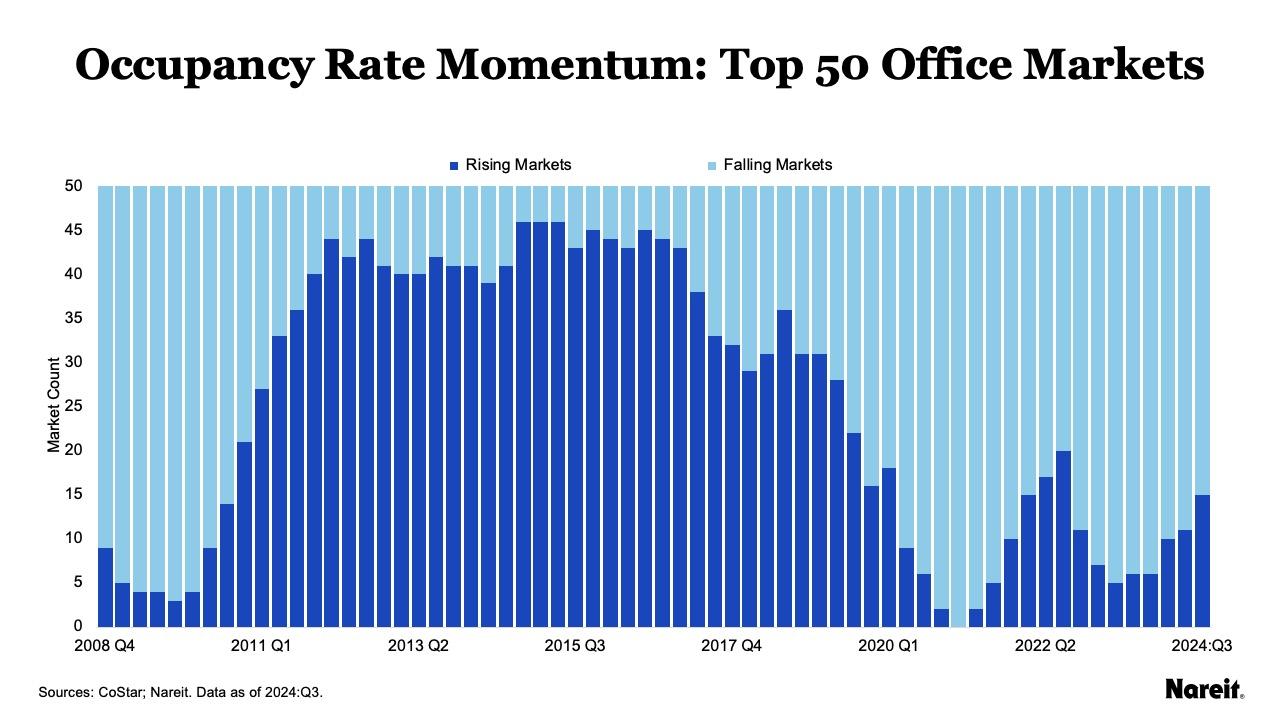
The chart above depicts the number of markets that had rising or falling year-over-year occupancy rates for the largest 50 office markets by asset values from the fourth quarter of 2008 to the third quarter of 2024. Among the four traditional property types, the office sector has experienced the greatest challenges with its fundamentals. Showing tepid signs of recovery, top office markets have faced fits and starts in their attempts to regain their footings over the last several years.
As of the third quarter of 2024:
- Fifteen of the top 50 office markets had increasing occupancy rates; 35 markets had declining rates.
- Average occupancy rates for rising and falling office markets were 90.2% and 86.4%, respectively.
While many of the top office markets have struggled to gain traction, the sector should not be painted by a broad brush. Performance across different office segments has varied markedly. In general, newer, high-amenity properties in solid locations have enjoyed better performance. REITs own many of these types of office assets.
CRE Occupancy Rate Trends Underscore Need for Realism
Declining interest rate expectations have piqued investor interest in CRE at a time when property markets are still marked by supply-demand imbalances. CoStar occupancy rate data highlight generally waning fundamentals across the four traditional property types. As of the third quarter of 2024, each sector faced different occupancy rate momentum conditions across its top 50 markets. Retail still appeared healthy despite negative momentum. Apartment has started its recovery, slowly gaining positive momentum. Industrial has reached its bottom with respect to positive momentum. Office has been showing slow signs of recovery, but challenges remain. With the expected revival of the transaction market, investors should take heed of these conditions as they will likely weigh on future property operational performance.