In the fourth quarter of 2024, CoStar data showed that fundamentals across the four traditional property types were marked by supply-demand imbalances, but some nascent signs of stabilization were also evident. Each sector’s ability to make continued progress in moving toward its equilibrium will likely determine the strength of its property operational gains in 2025.
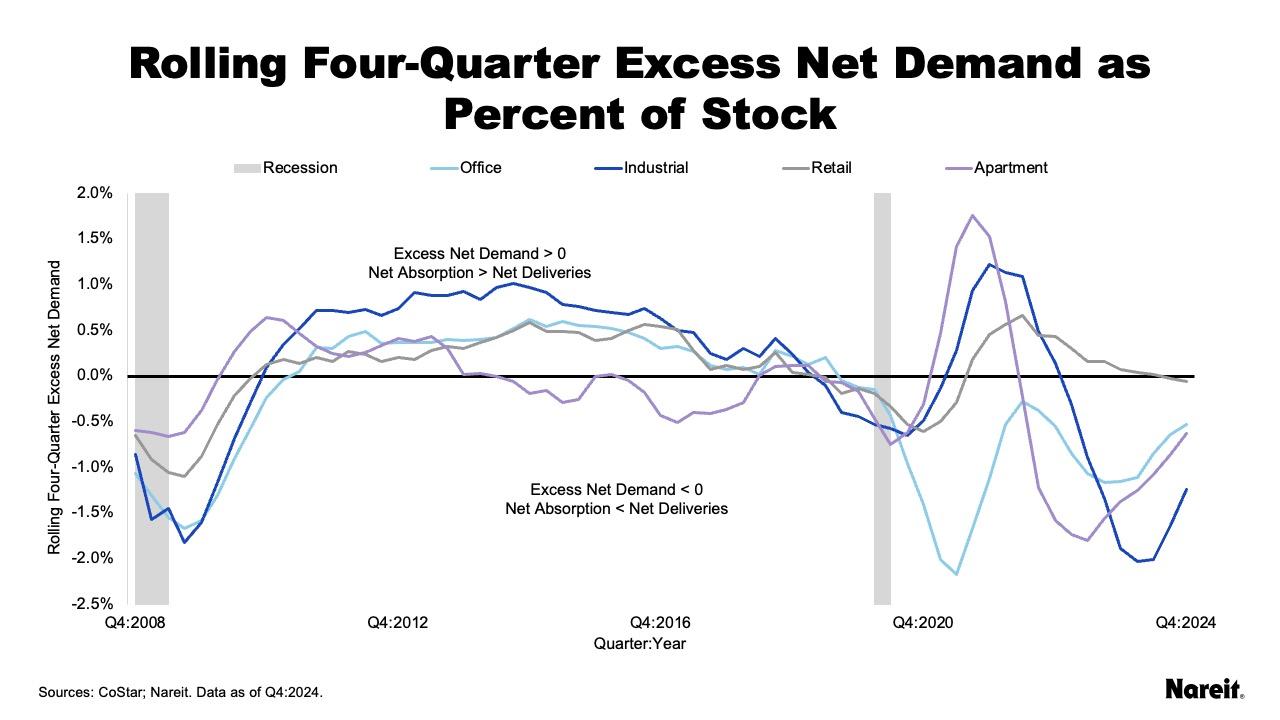
The chart above shows rolling four-quarter excess net demand as a percentage of existing stock by property type from the fourth quarter of 2008 to the fourth quarter of 2024; it also displays U.S. recessions. In the last quarter of 2024, net absorption fell short of net deliveries for each of the four traditional property types.
Although recent fundamentals have generally been balanced, retail excess net demand posted a modest negative value for the second quarter in a row. Demand has fallen short of supply for industrial, apartment, and office for eight, 11, and 22 consecutive quarters, respectively. While excess net demand remained negative for these three sectors, each saw recent improvement. Benefits for industrial and apartment were achieved by curtailing supply; office advances stemmed from improving demand. Property fundamentals may be imbalanced, but markets are making progress toward reaching their respective equilibriums.
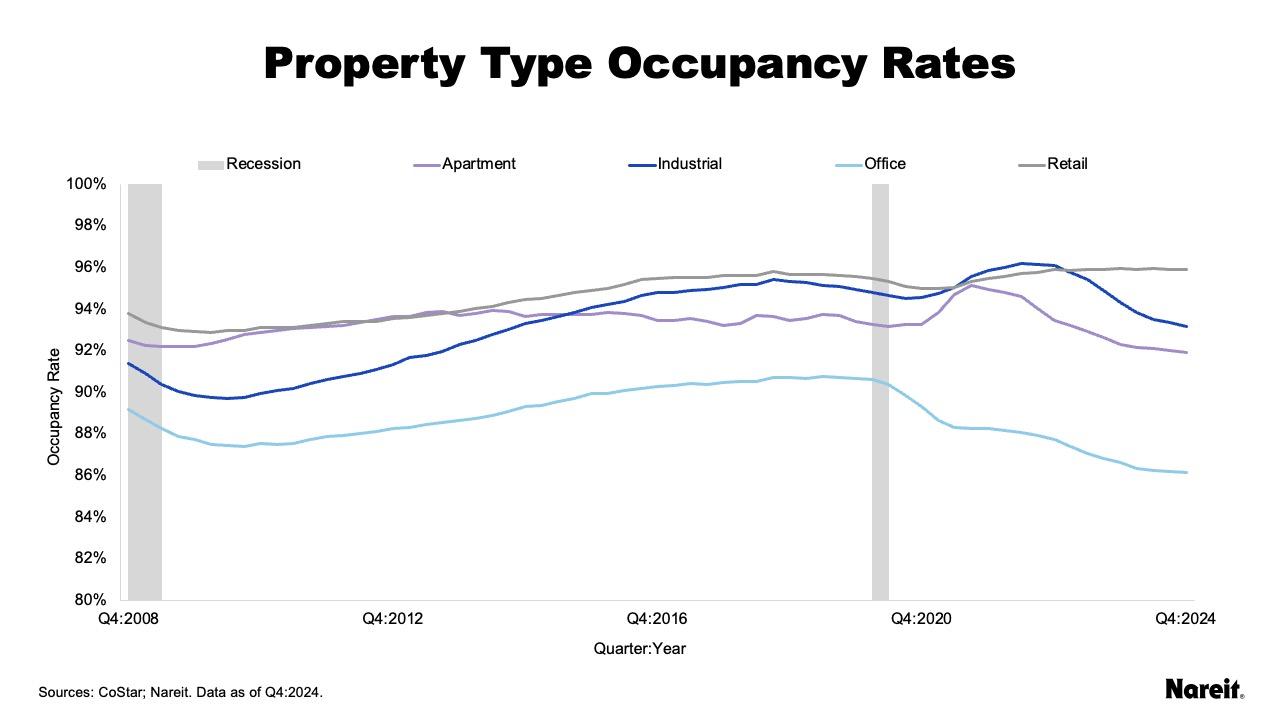
The chart above depicts occupancy rates for the four traditional property types, as well as U.S. recessionary periods, from the fourth quarter of 2008 to the fourth quarter of 2024. Retail occupancy appears to have plateaued at 95.9%. Industrial, apartment, and office occupancy rates have followed downward trajectories, but recent paces of these declines have slowed and shown some signs of stabilization.
Industrial occupancy has declined for eight consecutive quarters, ending below its pre-pandemic level at year end. Apartment and office occupancy rates have reached their lowest levels in 25 years. In the fourth quarter of 2024, apartment occupancy was 91.9%. Office occupancy has stood at 86.2% for two consecutive quarters.
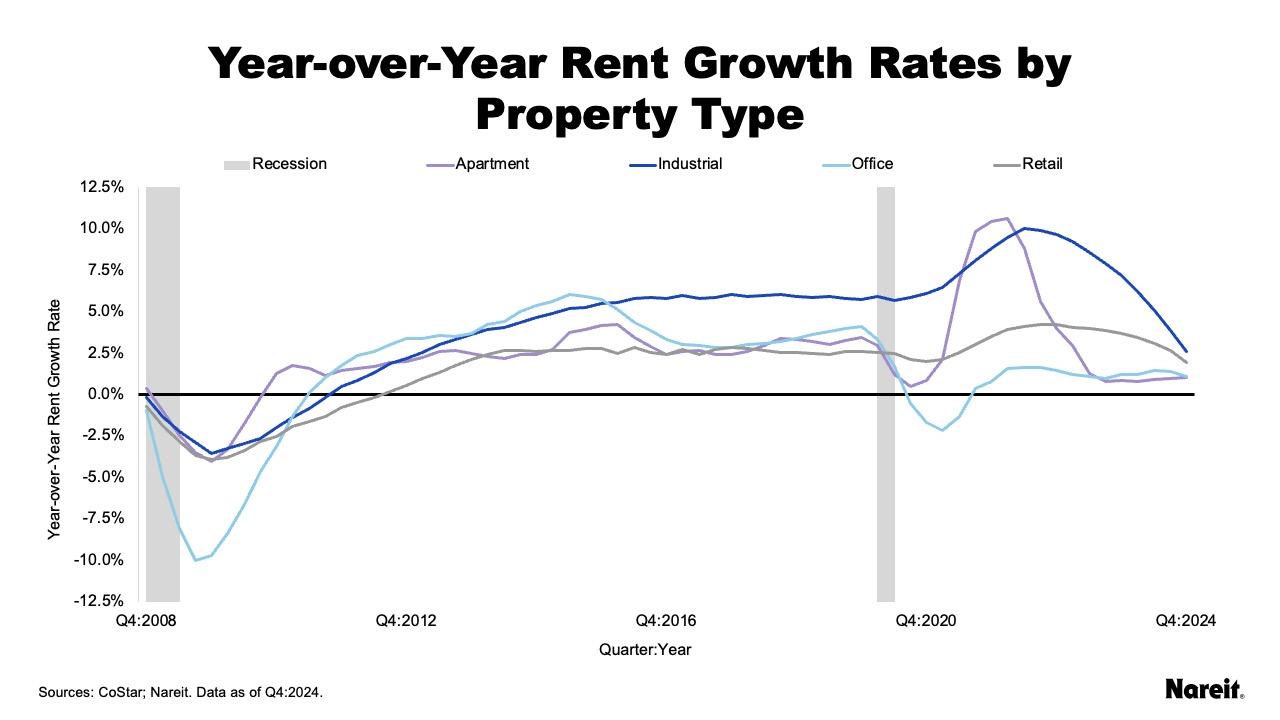
The chart above presents year-over-year rent growth rates by property type from the fourth quarter of 2008 to the fourth quarter of 2024, and also includes U.S. recessionary periods. After reaching double-digits in 2022, industrial rent growth dropped to 2.6% at year-end 2024. Retail followed a similar, but more modest downward trend, declining from a peak of 4.2% in the latter half of 2022 to 2.0% in the fourth quarter of 2024.
The apartment rent growth rate reached a historical high of 10.6% at the beginning of 2022. It has since plunged and stabilized near 1.0%. Despite historically low occupancy rates, office continued to maintain positive rental gains; the sector posted year-over-year rent growth of 1.1% in the last quarter of 2024. Although rent growth rates have been falling or leveling off across the four traditional property types, they have continued to post positive gains.
While today’s property market tends to be characterized by supply–demand imbalances, declining/low occupancy rates, and moderating/low rental growth rates, signs of stabilizing fundamentals have started to percolate. As markets move toward their equilibriums, both occupancy and rental growth rates will likely rise, benefiting property operational performance.