Occupancy rates are indicators of property fundamentals that reflect the interaction of supply and demand. Focusing on the four traditional property types, recent data indicate that, on average, REIT industrial, apartment, and retail occupancy rates have continued to exceed 95%. Apartment, retail, and office REITs have also enjoyed higher occupancy rates than their private market counterparts. These high absolute and relative results showcase REITs’ prowess when it comes to asset selection and management.
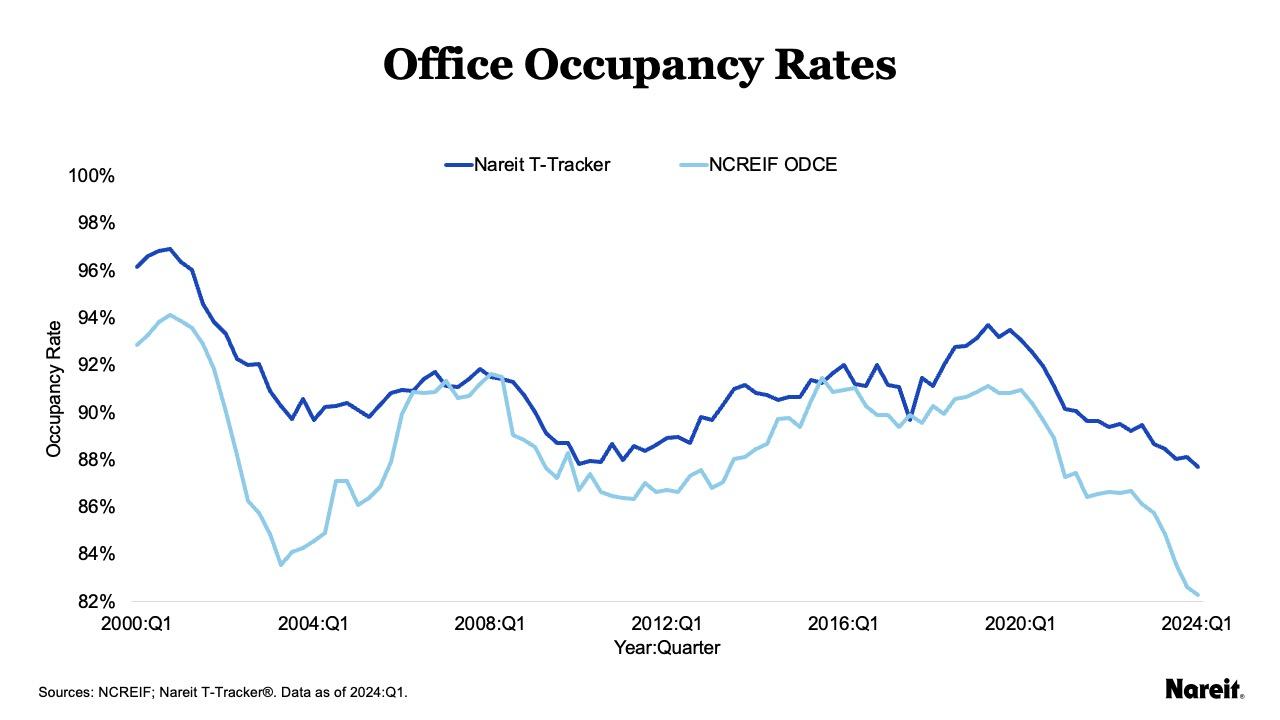
The chart above depicts public and private office occupancy rates since the first quarter of 2000. Data from the Nareit Total REIT Industry Tracker Series® (T-Tracker) and National Council of Real Estate Investment Fiduciaries (NCREIF) focus on properties from U.S. public equity REITs and Open End Diversified Core Equity (ODCE) funds, respectively.
Since 2000, office REITs have generally maintained an occupancy advantage (averaging 2.4%) over their ODCE counterparts. Ongoing office supply-demand challenges have driven the sector’s occupancy rates to the lowest levels among the four traditional property types. As of the first quarter of 2024, Nareit T-Tracker and NCREIF ODCE posted average office occupancy rates of 87.7% and 82.3%, respectively. The public-private spread has now widened to more than double its historical average.
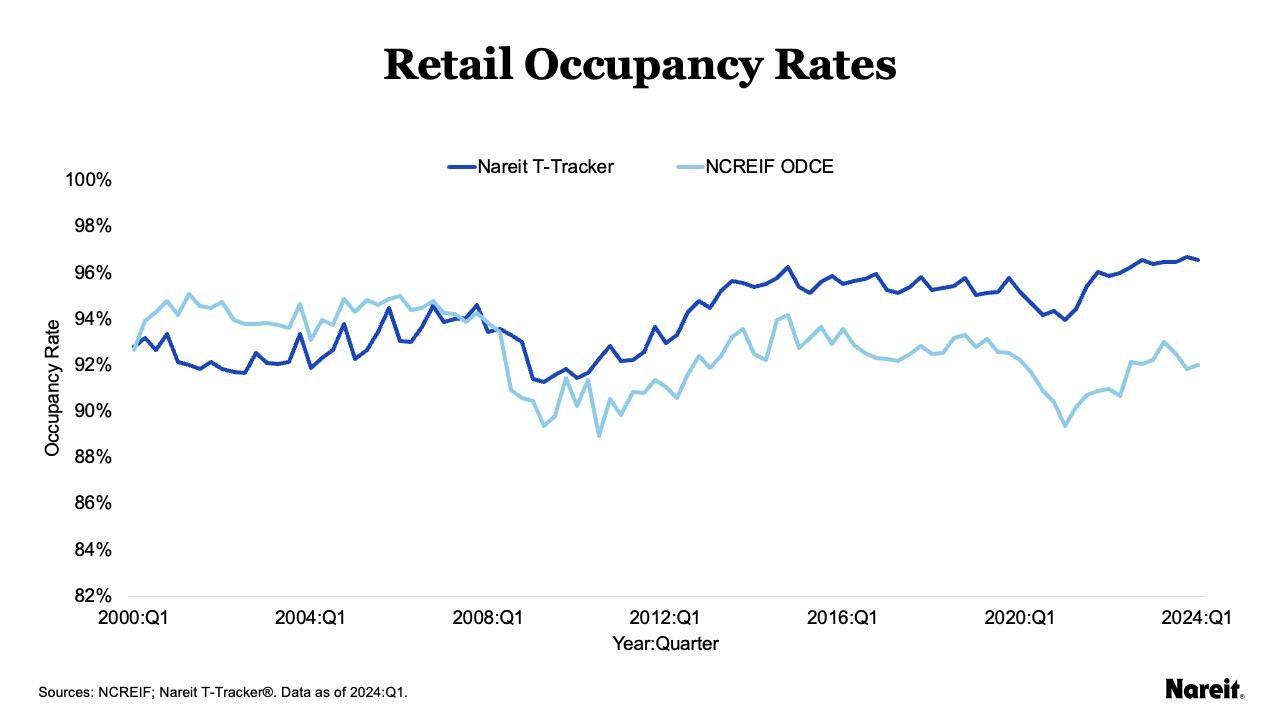
The chart above presents Nareit T-Tracker and NCREIF ODCE retail occupancy rates from the first quarter of 2000 to the first quarter of 2024.
A reversal of retail fortunes occurred during the Global Financial Crisis. Prior to the first quarter of 2008, private retail properties, on average, held the occupancy advantage. Since that time, REIT retail occupancy rates have exceeded their ODCE counterparts by an average of 2.8%. In recent years, the gap has grown substantially wider. In the first quarter of 2024, the REIT retail occupancy rate averaged 96.6%; it was 92.0% for ODCE fund properties. The public-private spread currently stands at 4.6%.
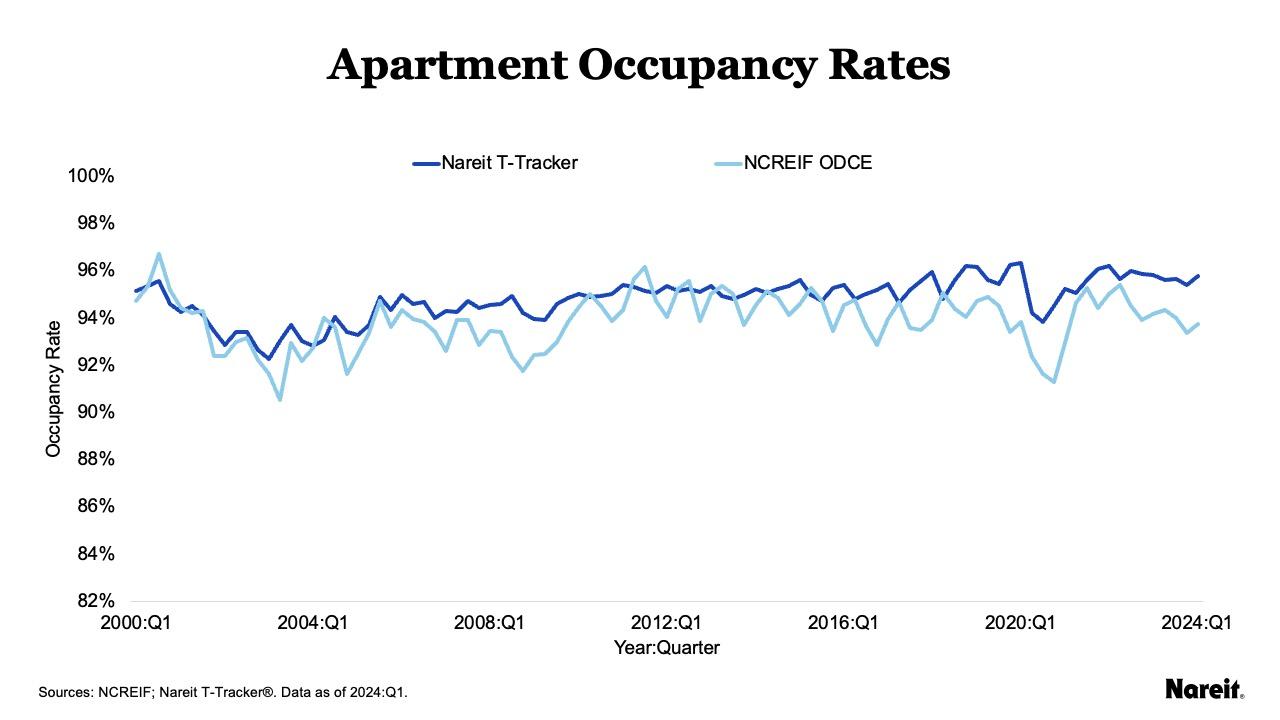
The chart above displays Nareit T-Tracker and NCREIF ODCE apartment occupancy rates from the first quarter of 2000 through the first quarter of 2024.
From the first quarter of 2000, quarterly Nareit T-Tracker apartment occupancy rates have exceeded those from NCREIF ODCE fund properties more than 80% of the time. Overall, the average public-private difference was 0.9%. As of the first quarter of 2024, Nareit T-Tracker and NCREIF ODCE posted average apartment occupancy rates of 95.8% and 93.7%, respectively. Similar to the office sector, the public-private spread now has more than doubled its historical average.
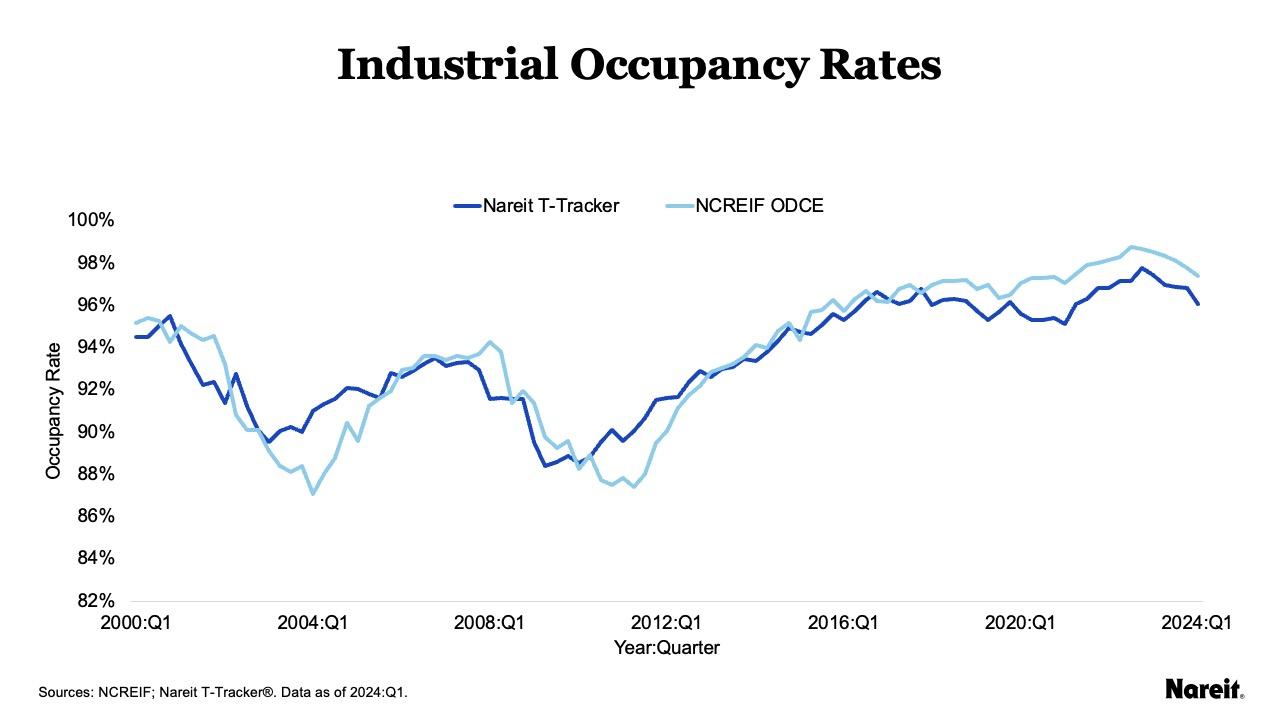
The chart above highlights Nareit T-Tracker and NCREIF ODCE industrial occupancy rates from the first quarter of 2000 through the first quarter of 2024.
Over the examined time period, the public and private industrial sectors have frequently traded places in taking the occupancy rate lead. Since the first quarter of 2018, ODCE industrial occupancy rates have exceeded their REIT counterparts by an average of 1.3%; the current gap has remained at a comparable level. Although REIT industrial occupancy rates have been lagging, they have maintained exceptionally high levels. As of the first quarter of 2024, the REIT industrial occupancy rate averaged 96.1%.
U.S. public equity REIT data have shown considerable strength and persistence in occupancy rates. T-Tracker data indicate that, on average, REIT industrial, apartment, and retail occupancy rates have continued to exceed 95%. Comparing REIT metrics with those from NCREIF ODCE fund properties shows that, on average, REITs have enjoyed occupancy rate advantages across the apartment, retail, and office property types. These outcomes highlight REIT prowess in asset selection and management.