Investors use Sharpe ratios as a simple measure of risk adjusted return or, put differently, return per unit of risk. Looking at historical Sharpe ratios can sometimes inform future asset allocations. In this latest update of Sharpe ratios across REIT sectors, we conclude that this is unlikely to hold true.
Property sectors that were most affected by the pandemic shutdowns and subsequent changes in behavior have the lowest risk adjusted returns, but this is not necessarily predictive of future volatilities or returns. This update also shows the importance of diversifying portfolios across property sectors, given that the FTSE Nareit All Equity REITs index has a lower volatility than any of the individual sectors.
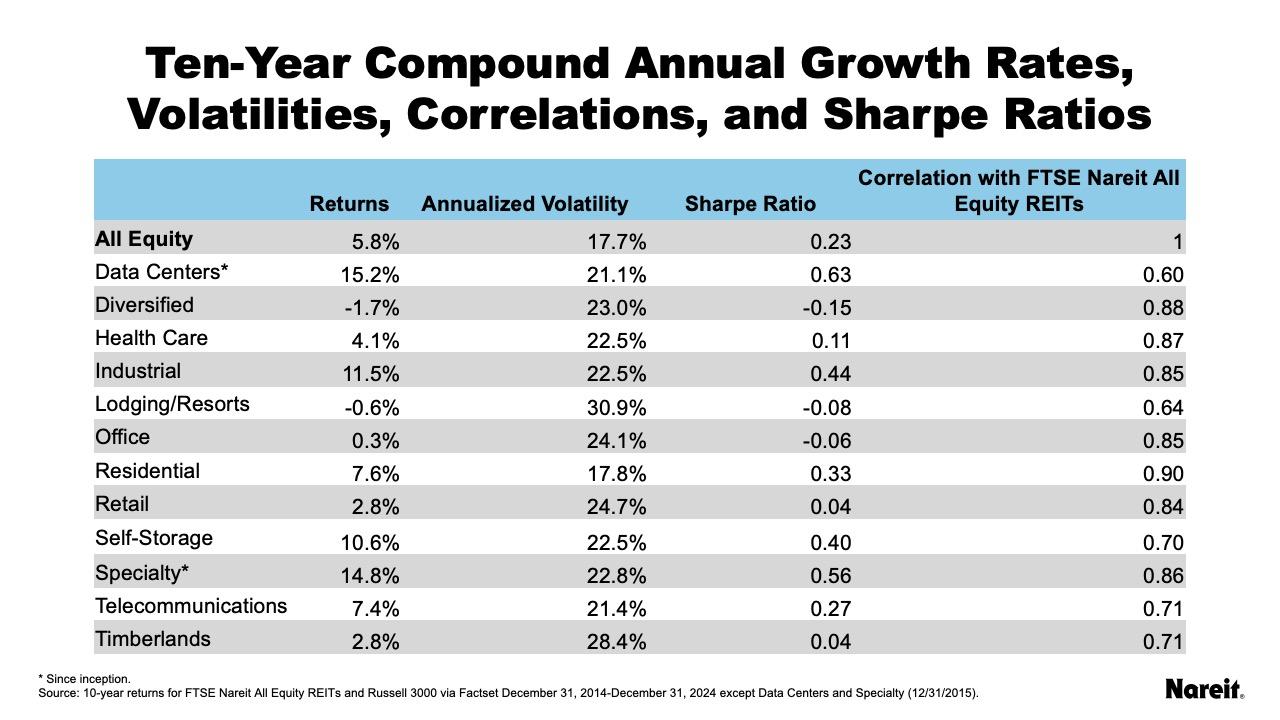
The table above shows the 10-year compound annual growth rate (CAGR), annualized volatility for monthly returns, the Sharpe ratio, and the correlation with the All Equity index for each property sector. Note that the specialty and data centers sectors do not have 10 years of returns. The CAGR for All Equity is 5.8% for the 10-year period of Dec. 31, 2014 to Dec. 31, 2024. Data centers and specialty (measured since inception at Jan. 31, 2016) had the highest CAGRs of the sectors, with 15.2% and 14.8% respectively. Office, lodging/resorts, and diversified all had low growth rates over the 10 years. Yet with the exception of lodging/resorts, there are only small differences in the volatilities in these property sectors.
In terms of volatility, the All Equity index has a monthly volatility of 17.7% over the 10 year period, lower than any individual property sector. The sector with the lowest volatility is residential—only 0.2 percentage points higher than the All Equity index. Sectors that were favored by the pandemic like data centers (21%), telecommunications (21%), and industrial (22%) all have relatively lower volatilities. On the other hand, sectors that were strongly hit by shutdowns had some of the highest volatilities. Lodging/resorts has the highest volatility at 31% followed by timberlands at 28%.

In comparing Sharpe ratios across property sectors, most of the variability comes through the returns rather than through volatility. Generally, volatility and returns are negatively correlated: the higher the returns, the lower the volatility, as shown in the chart above. Property sectors that have consistently outperformed the FTSE Nareit All Equity REITs Index in the past 10 years, like industrial and telecommunications, also have the highest Sharpe ratios. Property sectors that were most affected by the pandemic shutdowns, such as lodging/resorts, office, and diversified, have the lowest.
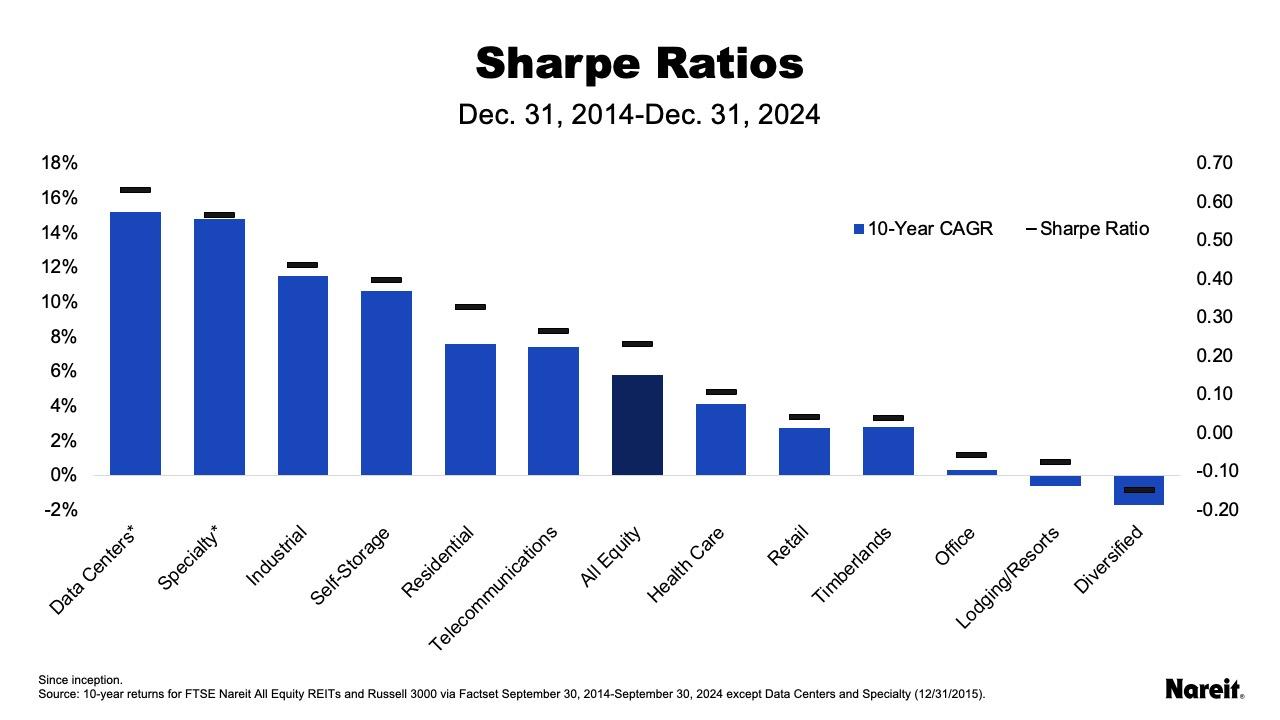
The chart above shows the 10-year CAGR in the blue bars with the sector’s Sharpe ratio in the black dashes. Given that there are generally small differences in volatilities between the sectors, and that returns and volatilities are negatively correlated, the result is that Sharpe ratios do not tend to provide valuable information in comparing sectors. The rank order of sectors for Sharpe ratios is the same as the rank order for returns.