Study Highlights
- After fees, actively managed REIT portfolios generated a value-added return of 0.32%; private real estate portfolios generated a negative net value added return of -0.68%.
- Over the period studied, 55% of REIT portfolios beat their benchmark after fees, while just 44% of private portfolios beat their benchmark after fees.
- In a typical year, after fees, REITs outperform private real estate in total returns across the distribution of returns. For example, a top-quartile (75th percentile) REIT strategy outperforms a top-quartile private real estate strategy by more than 2.23% per year.
- REIT outperformance across the returns distribution suggests that private real estate investors who focus their strategies on top-quartile real estate managers could enhance returns by selecting top-quartile active REIT managers.
About the Study
CEM Benchmarking’s 2024 study (PDF), sponsored by Nareit, shows that REIT active management has consistently added net value in CRE portfolios. The study spans a 24-year period (1998–2021) and uses a unique data set representing more than 350 U.S. institutional investors, primarily defined benefit (DB) pension funds. Portfolio performance is measured against the investor’s chosen benchmark.
REIT Active Management Adds Net Value Added
Over the 24-year period covered by the study, actively managed REIT portfolios have consistently outperformed private real estate in terms of outperforming their relevant benchmark or "net value added."
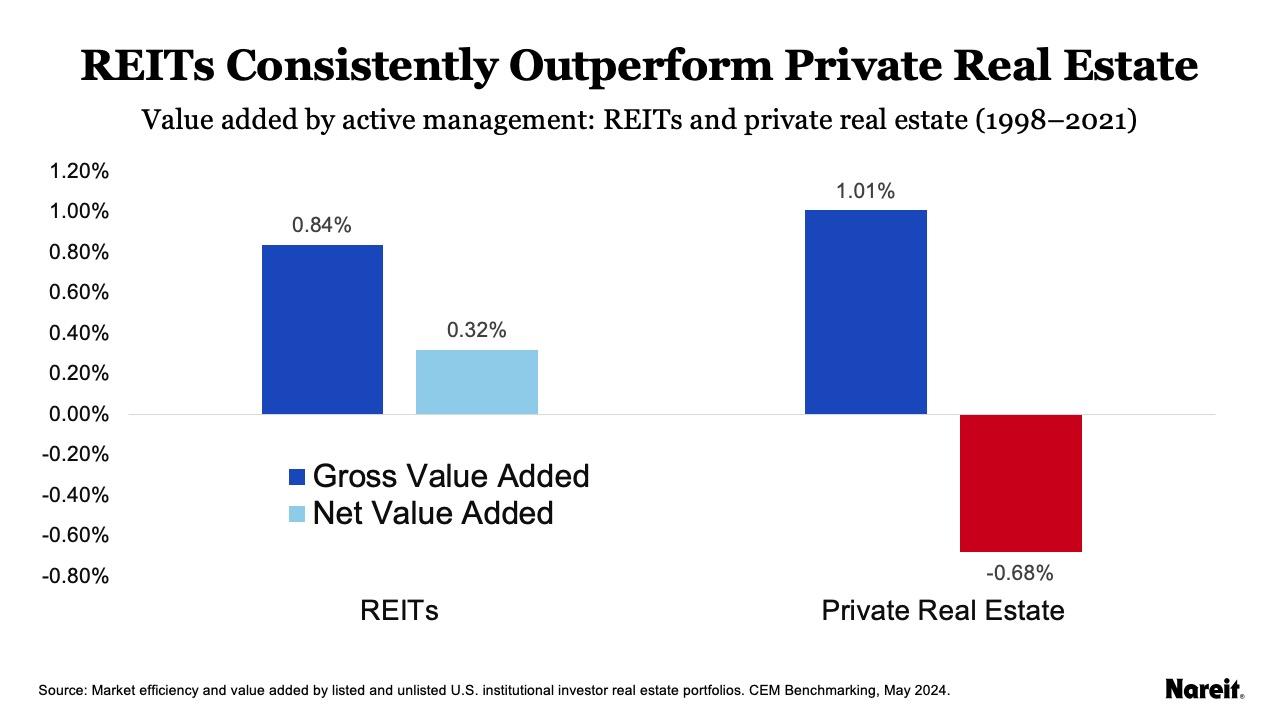
As the chart above shows:
- Before fees, actively managed REIT portfolios generated an annual average gross value added return of 0.84% per year versus an annualized benchmark return of 9.6%. After fees, on a net basis, actively managed REIT portfolios generated a net value-added return of 0.32%.
- Before fees, private real estate portfolios generated an annual average gross value added return of 1.01% per year versus an annualized benchmark return of 9.1%. After fees, on a net basis, private real estate portfolios generated a negative net value added return of -0.68%.
REITs Add Value Across Distribution
The unique nature of the CEM data allows the report to explore the distribution of returns on a net return and net value-added basis.
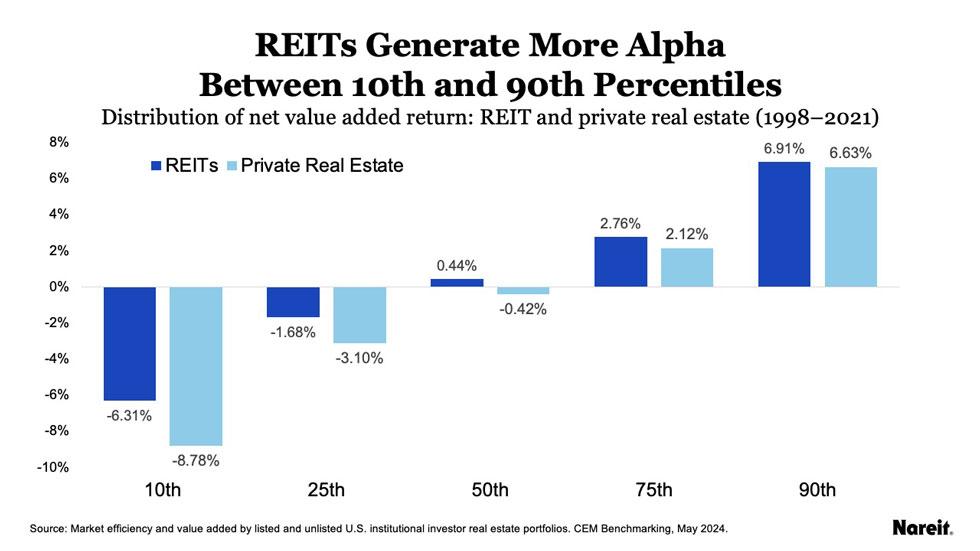
As the chart above shows, after fees, REITs outperform on a value-added basis between the 10th and 90th percentiles of the value-added distribution. In the extreme positive tail (above the 95th percentile) of the distribution, private real estate outperforms REITs; in the extreme negative tail of the distribution, private real estate significantly underperforms REITs.
The REIT outperformance suggests that private real estate investors who focus their strategies on top-quartile real estate managers could enhance returns by selecting top-quartile active REIT managers.
REITs Net Returns Outperform Across the Distribution
The study also examines the distribution of gross and net returns. The study reports the distribution of gross and net returns in a “typical” year.
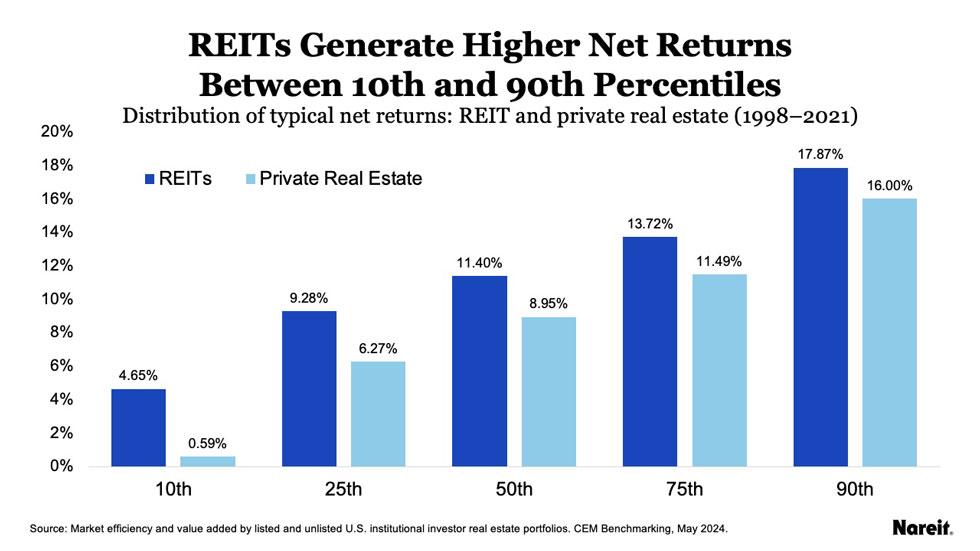
As the chart above shows, after fees, REITs outperform between the 10th and 90th percentiles of the typical returns distribution.
In other words, at almost any percentile of REIT performance, REITs generate more alpha and higher net returns than at almost any percentile of private real estate performance.
Again, this REIT outperformance suggests that private real estate investors who focus their strategies on top-quartile real estate managers could enhance returns by selecting top-quartile active REIT managers.
Conclusion
CEM Benchmarking’s 2024 study (PDF) shows that REIT active management has consistently added net value in CRE portfolios.
Resources
- Download the 2024 study (PDF)
- Download the 2024 executive summary (PDF)
- Learn about CEM Benchmarking’s additional study, showing how REITs outperform private real estate in DB plans