July 20, 2020 - Nareit has conducted its fourth monthly survey of REIT rent collections in the wake of the COVID-19 pandemic and related economic dislocation. The July results show another large improvement for the retail subsectors for free standing and shopping center-focused REITs following substantial improvement in June. Re-openings of the retail sector in many parts of the country in May continue to have a positive economic impact for retail REITs. The other sectors showed little change from June with continued strong rent collections.
Nareit’s survey includes listed equity REITs that combined own and operate between 10% and 20% of commercial real estate in the U.S.
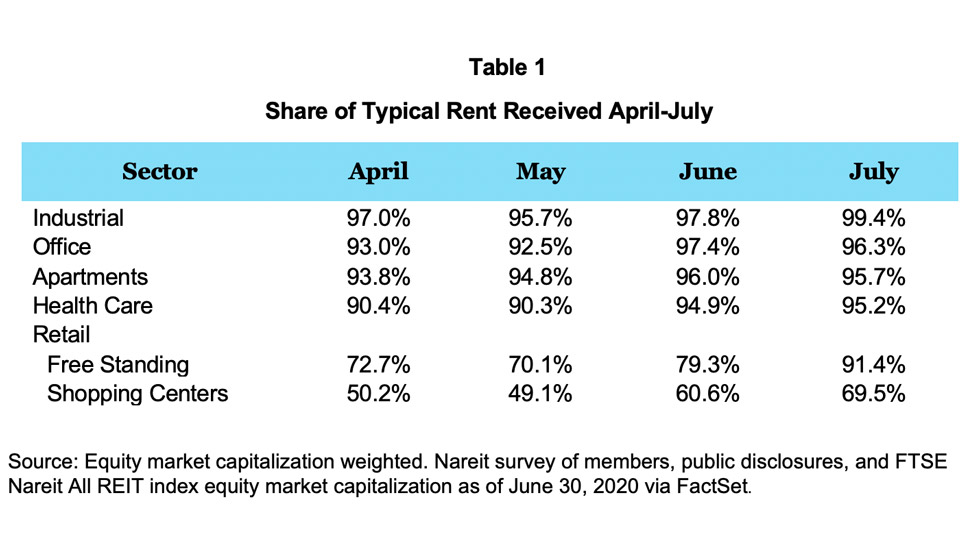
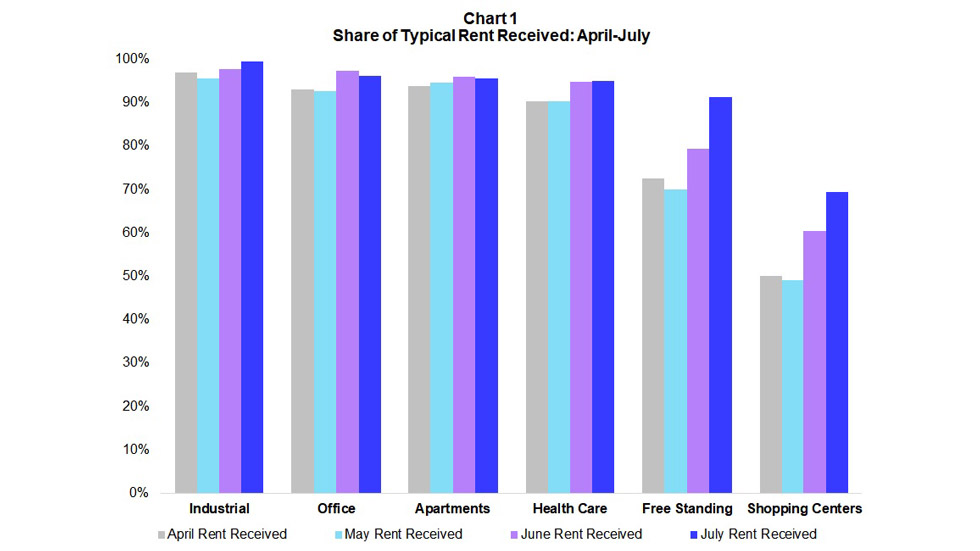
Table 1 shows the estimated REIT rent collections from April to July as a share of typical rent collections. A visualization of the results is in Chart 1. The results are displayed by property sector and are weighted by respondent REIT equity market capitalization.
A total of 34 equity REITs are included in the sample for July across the six property sectors (industrial, apartments, office, health care, free standing retail, and shopping centers). The sample represents 53% of the FTSE All REITs total equity market capitalization for those property sectors. Sectors are only reported where survey participation is sufficient to maintain participant confidentiality.
Results
- In the retail sector, there are three sub sectors: shopping centers, regional malls, and free standing retail. Survey participation did not warrant the release of results for malls. The prevalence of essential businesses such as grocery and drug stores among the tenant base for many shopping center and free standing REITs is a stabilizing factor for these types of retail properties.
- There are more than 16,000 REIT-owned free standing retail establishments across the U.S., including big box stores, pharmacies, convenience stores and restaurants. Once again, free standing made substantial gains in rent collected, up over 12 percentage points to 91% in July. This was accompanied by a substantial decrease in deferred rent by equity market. While May and June survey respondents in free standing reported granting rent deferrals for over 17% of their May and June rent, July deferrals were down to 7%.
- The U.S. has nearly 2,700 REIT-owned shopping centers. Shopping center REITs continued to make gains in July up to 69% of July rent collected. The sector’s forbearance rate for July survey respondents show REITs granting forbearance for only 1% of rent owed compared to 9% in June.
- The industrial sector remained the strongest performer with collections equal to nearly 100% of typical rents in July. Survey respondents did not report any forbearance for May through July but did report deferring 1% of sector rent in June and July. Industrial REITs own nearly 4,900 industrial properties in the U.S.
- The office sector’s June rent collections fell slightly from June decreasing to 96% in July. June survey respondents reported deferring 1.5% of sector rent owed by equity market cap while July survey respondents reported deferring 1.7%. There are nearly 1,800 REIT-owned office properties in the U.S.
- Apartment collections remained substantially the same at 96% of typical rents collected in June and July. Rent collections for June and July remain higher than in April and May.
- May survey respondents reported granting rent deferrals for 3% of rent owed, which dropped to 1% for June survey respondents, and fell further in July to less than 1%.
- The ability of apartment renters to meet their rent obligations reflects the increasing economic activity and the fact that REIT apartments generally serve a population less likely to be affected by layoffs.
- The health care sector results reflect a mix of business models, with more than 4,500 senior residential properties and more than 2,800 medical facilities including hospitals and medical office buildings. REITs in the sample held onto their gains from previous months, with July rent collections at 95%. July survey respondents reported substantially the same level of rent deferrals in July as in June for 4% of rent by equity market cap.
Methodology
This research note uses data from Nareit’s April, May, June, and July rent surveys and publicly disclosed data matched to June’s month-end equity market capitalization. Adding public disclosures did not significantly change results.
The rents for April and May are from either the Nareit surveys or public disclosures while June and July data are from survey respondents only. A comparison analysis using a matched sample of REITs with valid rent collection data for all months from April to July produced very similar results. In general, the results do not differ significantly if we use all the available data for each month, restrict the sample to only Nareit survey respondents, or use only those REITs present in the sample for all months.
Several REITs both responded to the surveys and publicly disclosed their April and May rents; the survey data is used in this analysis. The survey asked respondents both the percent of rent collected and the percent of rent typically collected in the same month. In public disclosures, some REITs only disclosed the percent of rent collected. In those cases, we assume typical rent collected is 100%. Some REITs collected more than their typical amount of rent in May. We top coded the share of rent received at 100%.