The outlook for equity REITs’ operating performance in 2016 depends in many ways on the impact of rising interest rates. How much will higher interest payments affect earnings? How solid are REIT balance sheet positions? Will higher short-term rates cause any difficulties covering interest payments?
One way to gauge the impact of a Fed tightening on REITs is to examine the 2004-2006 cycle of interest rate increases. Similar to today, at that time the Fed had kept rates at what was then considered a historically low level, for a fairly long period, and subsequently embarked on a series of gradual increases in its target for short-term interest rates.
REITs performed well during this period, despite a 425 basis point increase in short-term interest rates. Consider:
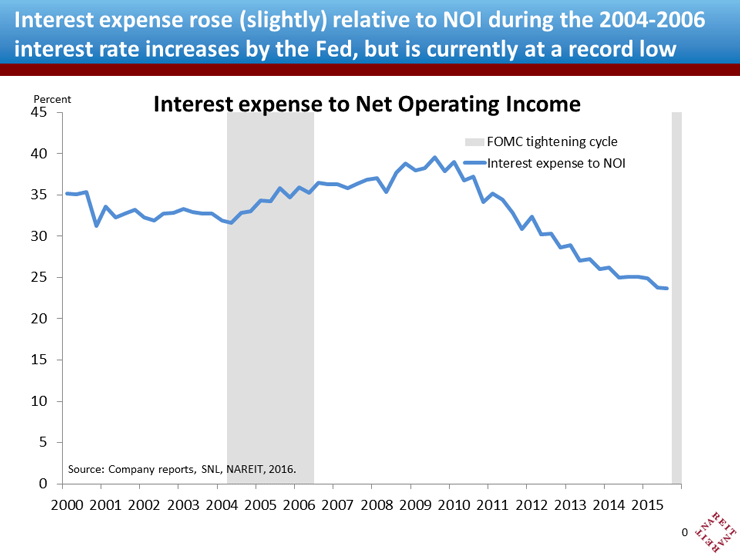
- Interest expenses rose only slightly relative to net operating income (NOI) (Chart 1). In part this is because falling vacancy rates and rising rents cause NOI to grow more rapidly during economic expansions, which is also true today. In addition, most equity REITs have little exposure to short-term interest rates, relying more heavily on equity capital and long-term debt. Long-term rates did not rise sharply during the prior tightening cycle, and are not expected to rise sharply over the next few years.
- Interest expense relative to NOI is currently at a record low. Interest expense relative to NOI moved steadily downward since 2010, to less than 24% of NOI, compared to the 32% share of NOI in early 2004. Low interest rates have contributed to this reduction in interest expenses. But REIT balance sheets are also stronger, as seen in the next bullet and chart.
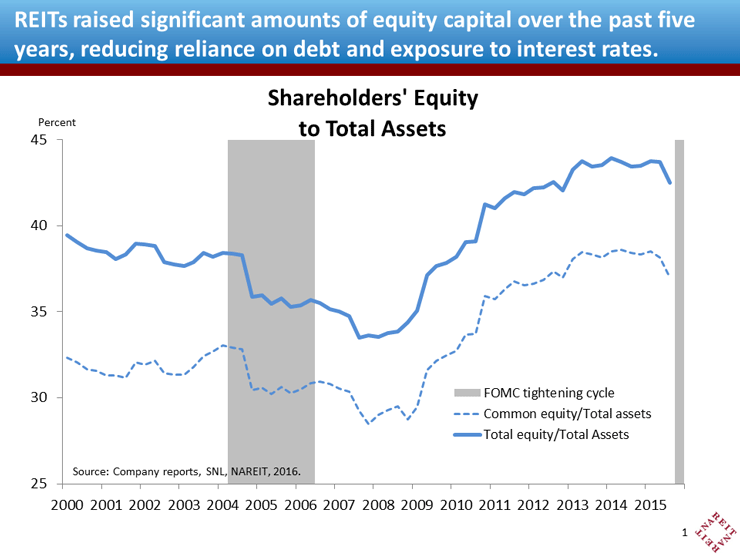
- Equity REIT balance sheets have higher capital, and relatively less debt, than a decade ago. REITs issued significant amounts of equity capital in recent years. As a result, total book equity to book assets of all listed Equity REITs in 2015:Q3 was more than five percentage points above its level in 2004, and 10 percentage points above its trough in 2008 (chart 2). Stronger balance sheets limit equity REITs’ exposures to interest rates and also help protect against other shocks.
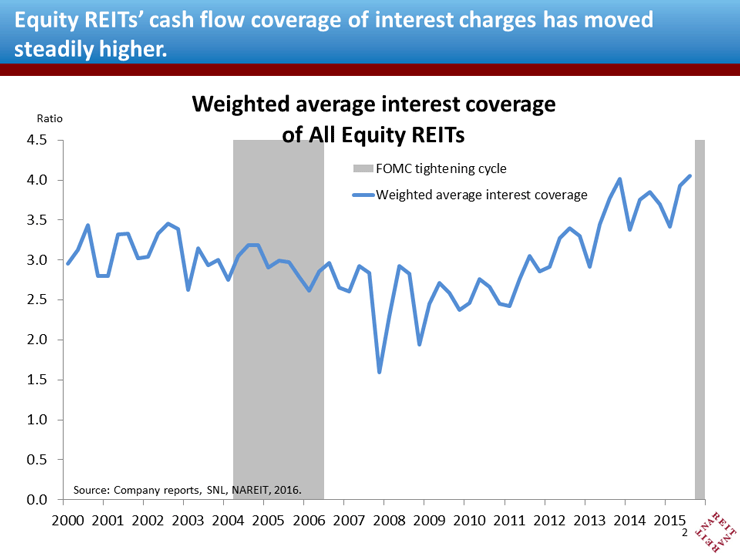
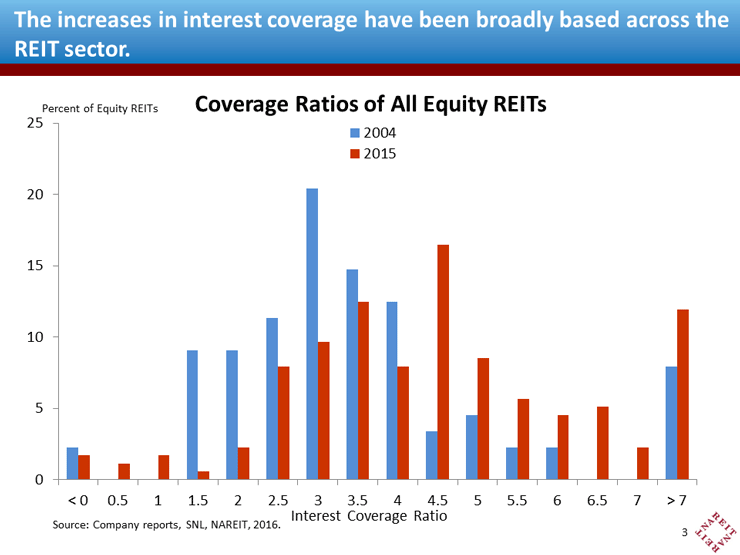
- Coverage ratios for interest charges are far higher than in 2004. The weighted average cash flow coverage of interest payments is above 4x, compared to 3x (or less) during the prior rate cycle (chart 3). On an industry-average basis, cash flows have ample room to absorb some rise in interest charges, especially as same-store NOI continues to grow at a 4% rate. Furthermore, the increase in coverage ratios has been broadly based across the REIT sector. In 2004, one out of five equity REITs had coverage ratios below 2x, compared to one in 14 today (chart 4). There has been a marked increase in those with very high cash flow coverage. In 2004, one in eight REITs had interest coverage ratios of 5x or higher, compared to one in three today.
Equity REITs today have higher capital ratios, lower interest expenses relative to NOI, and higher cash flow coverage of interest expenses than at the start of the Fed’s last tightening cycle in 2004. While the future will undoubtedly hold some surprises, the solid balance sheets and cash flows of equity REITs make them reasonably well positioned to weather the increases in short-term interest rates that lie ahead.


