September 23, 2020 - Nareit began conducting a monthly survey of REIT rent collections in April, in the wake of the COVID-19 pandemic and related economic dislocation. The September survey will be the last regularly scheduled rent collection survey. As the industry and the economy continue to recover, several REIT sectors have stabilized with high levels of rent collections. In other sectors where tenant distress results in continued rent collection difficulties, monthly data no longer provide the same level of insight and information after six months.
This update focuses on three property subsectors: apartments, free standing retail, and shopping center retail, given that rent collections in the industrial, office, and healthcare sectors have stabilized at high levels. Similarly, survey results show rent collections for apartments have remained high and steady over the whole six-month period. Free standing retail improved nearly five percentage points from August, bringing it to nearly 95% of typical rents collected. After large monthly gains from April, shopping centers saw a modest increase to over 81%.
Table 1 shows the estimated REIT rent collections from April to September as a share of typical rent collections. A visualization of the results is in Chart 1. The results are displayed by property sector and are weighted by respondent REIT equity market capitalization.
The survey participants represent 71% of the FTSE Nareit All REITs Index’s total equity market capitalization for the three covered property sectors (apartments, free standing retail, and shopping centers).
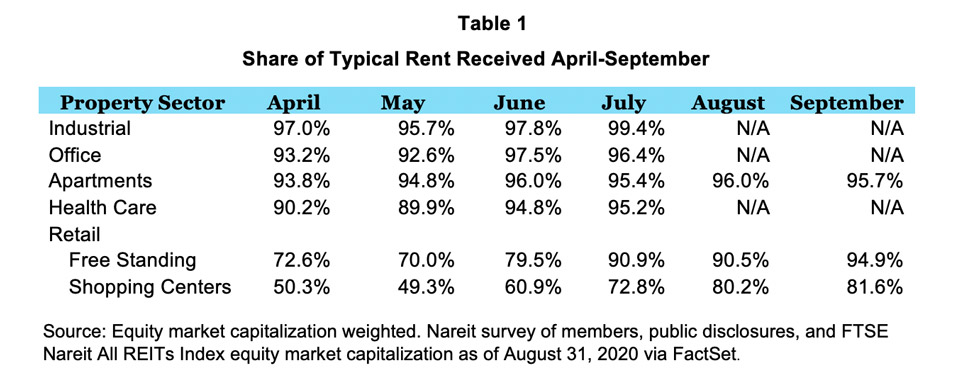
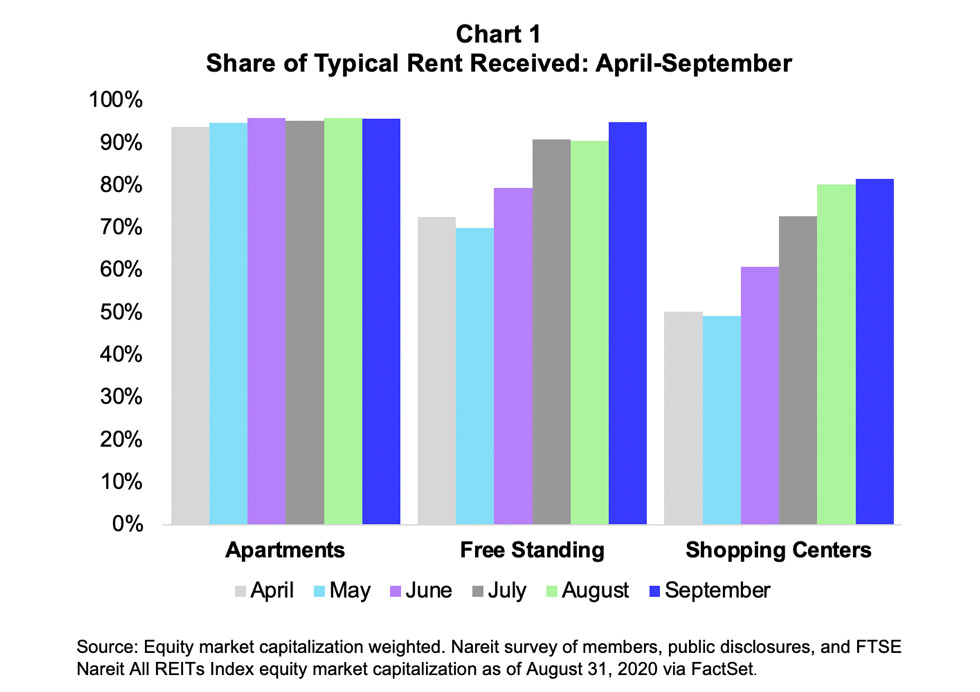
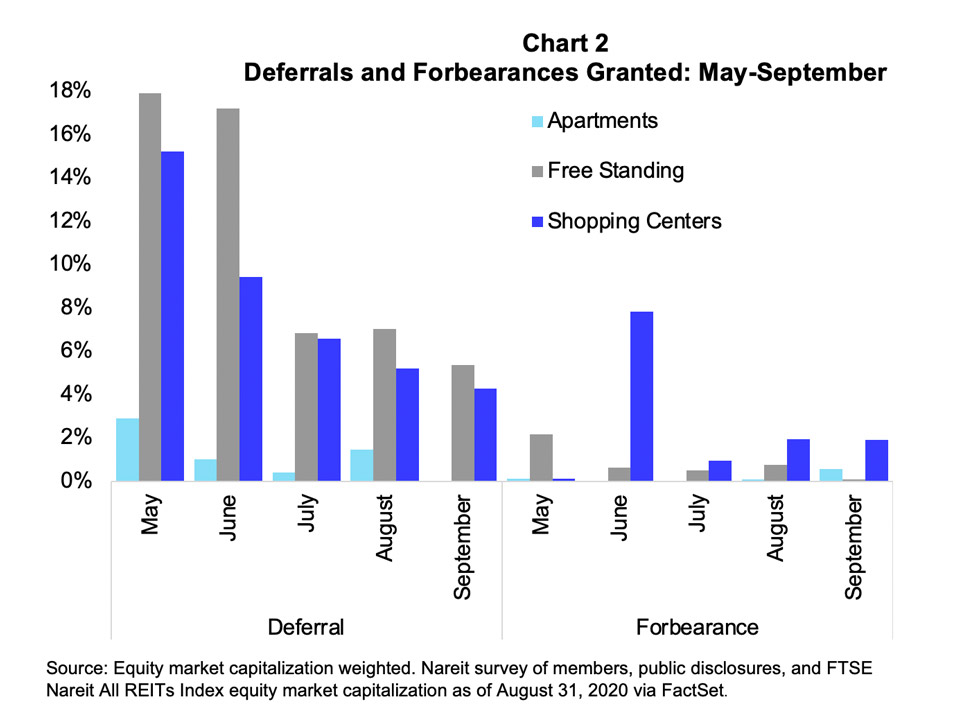
Chart 2 shows the percentage of rent owed granted deferral or forbearance by equity market cap. Apartment deferrals and forbearance continue to be minimal. Both retail subsectors show a fairly steady downward trend in deferrals from May to just over 5% in September for free standing and roughly 4% for shopping centers. Forbearance remained low in September, with apartments and free standing less than 1% and shopping centers steady at 2%.
Results
- Apartment collections remained substantially the same at 96% of typical rents collected in September by equity market capitalization. Since May, rent collections have hovered around the 95-96% mark.
- August survey respondents reported deferrals and forbearances under 1%.
- There are more than 16,000 REIT-owned free standing retail establishments across the U.S., including big box stores, pharmacies, convenience stores and restaurants. Free standing saw a small increase to 95% of typical rent collected in September by equity market capitalization. Deferrals and forbearances were down for the subsector. September free standing respondents reported granting rent deferrals for over 5% of their September rent, down from August’s 7%, and forbearances were near zero.
- The U.S. has nearly 2,700 REIT-owned shopping centers. Shopping center REITs held onto gains in August. The share of typical September rent collected was up to 82%, a modest increase compared to August’s. Rent deferrals again showed improvement, down to 4% in September from 5% in August. The subsector’s forbearance rate for September survey respondents stayed at 2%.
Methodology
This research note uses data from Nareit’s April through September rent surveys and publicly disclosed data matched to August’s month-end equity market capitalization. Adding public disclosures did not significantly change results.
The rents for April, May, and July are from either the Nareit surveys or public disclosures while June, August, and September data are from survey respondents only. A comparison analysis using a matched sample of REITs with valid rent collection data for all months from April to September produced very similar results. In general, the results do not differ significantly if we use all the available data for each month, restrict the sample to only Nareit survey respondents, or use only those REITs present in the sample for all months.
Several REITs both responded to the surveys and publicly disclosed their April, May, and July rents; the survey data is used in this analysis. The survey asked respondents both the percent of rent collected and the percent of rent typically collected in the same month. In public disclosures, some REITs only disclosed the percent of rent collected. In those cases, we assume typical rent collected is 100%. Some REITs collected more than their typical amount of rent in May. We top coded the share of rent received at 100%.