
Mid-Year Report: REITs Offer an Opportunity Amid Choppy Waters
The first half of 2024 has been characterized by economic uncertainty, higher interest rates and debt costs, waning property fundamentals, and continuing divergence in public and private real estate valuations. These conditions are likely to persist through the remainder of the year.
Year-to-date, U.S. public equity REIT total returns have been underwhelming. As the 10-year Treasury yield has risen, REIT total returns have typically fallen. During 2024, the 52-week correlation between REIT and 10-year Treasury total returns was consistently negative. It recently reached -0.7, a level not seen over the time period since 2001.
Despite headwinds and lackluster returns, U.S. public equity REITs are well-positioned for the remainder of 2024 for four key reasons:
- REIT operational performance has been solid. High absolute and relative occupancy rates in the face of supply-demand imbalances showcase REITs’ prowess in asset selection and management.
- Disciplined balance sheets are enabling REITs to enjoy greater operational flexibility and face less stress than their counterparts with higher debt loads and costs.
- Public real estate outperformance continues. On a cumulative total return basis, public real estate has outperformed its private market counterpart by nearly 33% over the last six quarters. Despite this outperformance, the public-private valuation divergence also continues. With capitalization (cap) rate spreads remaining wide, there is likely more fuel in the tank for REIT outperformance in 2024.
- REIT occupancy rate and pricing advantages have combined to suggest that REITs offer more for less and present an opportunity for real estate investors.
A deeper look at the U.S. economy and commercial real estate (CRE) markets shows why REITs are well positioned to navigate the economic environment and provide opportunities for investors over the remainder of 2024.
U.S. Economy: A Glass Half Full?
In the first half of 2024, the U.S. economy faced headwinds from sticky inflation and rising interest rates. At the same time, it enjoyed solid job gains and low unemployment with economic growth clipping along at a fair pace.
- Tempering earlier beliefs that the U.S. jobs situation was softening, total nonfarm employment increased by 206,000 jobs in June, an outcome similar to, but slightly below, the average gain over the past 12 months of 220,000 jobs. At the same time, the unemployment rate ticked up to 4.1%; a level not seen since November 2021.
- The Consumer Price Index for All Urban Consumers (CPI) increased 3.3% over the 12 months through May and core CPI (excluding food and energy) rose 3.4%. While these measures are considerably lower than their respective year-ago levels, they have exhibited stickiness, making limited progress toward the Federal Reserve’s 2% objective in 2024.
- After the June meeting, the Federal Open Market Committee (FOMC) decided to maintain its target policy rate range of 5.25% to 5.50%. Meeting minutes indicated that the FOMC would continue to assess data and that a target range reduction was likely when there was greater certainty that inflation was moving toward its 2% goal. After Fed Chair Powell’s congressional testimonies, investors placed the likelihood of a September rate cut at nearly 70%.
- During 2024, the 10-year Treasury yield has generally followed an upward trend. It started the year at approximately 4.0%, increased to 4.2% at the end of Q1, and stood at 4.5% by the end of May. Higher interest rates have created potential hardships for real estate investors that need to refinance their properties.
- Although the U.S. economic outlook remains uncertain, economists have become less concerned about the prospects of a recession. As of June, the Bloomberg consensus forecast survey placed the probability of a U.S. recession within the next 12 months at 30%. The likelihood of an economic downturn was 60% one year ago.
Many economists have become less concerned regarding the prospects of a U.S. recession, yet uncertainties remain. Potential downside economic risks include, but are not limited to, repercussions from bank failures, monetary policy missteps, and geopolitical shocks.
CRE Property Fundamentals & Financing: Under Pressure
The CRE market has not been immune from economic and financial market challenges. Today’s property market is generally marked by supply-demand imbalances, declining occupancy rates, and moderating rental growth rates. These conditions will likely place further pressures on property operational performance gains in 2024.
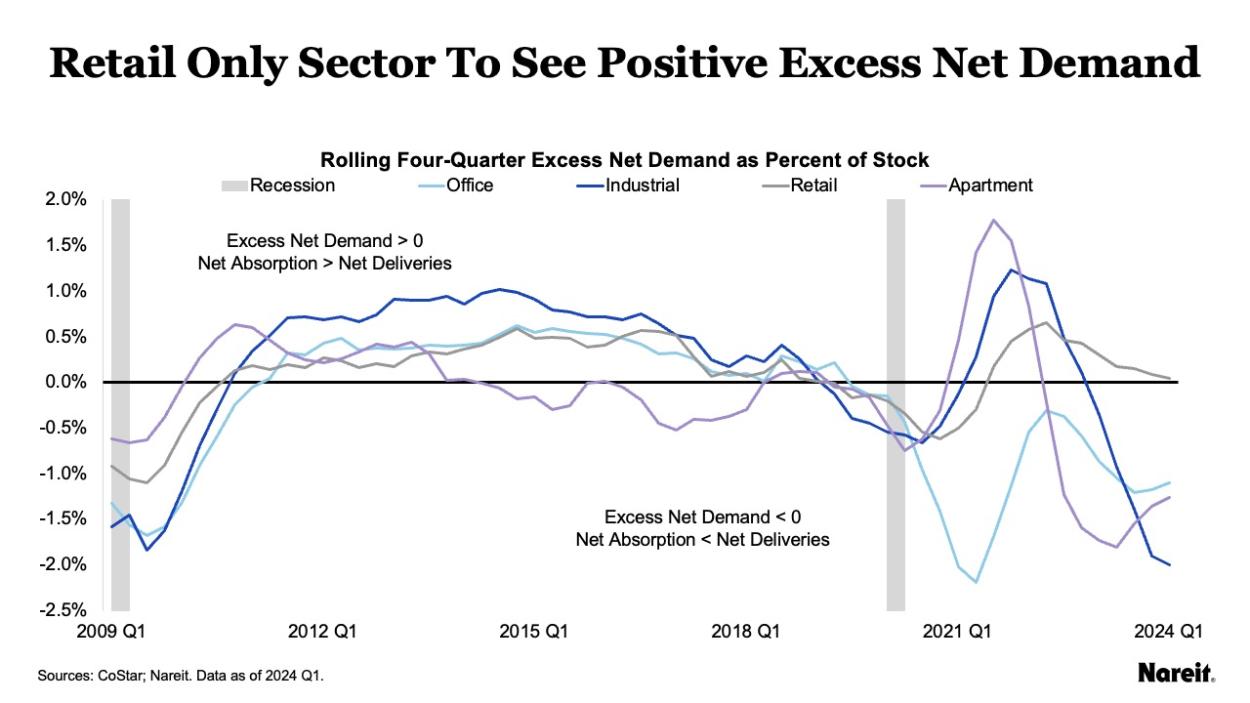

The chart above shows rolling four-quarter excess net demand as a percentage of existing stock for the four traditional property types from Q1 2009 to Q1 2024; it also displays U.S. recessions.
In Q1 2024, retail was the only property type that maintained a positive (albeit barely) excess net demand value. Excess net demand remained negative for the industrial, apartment, and office property types. Demand shortfalls have diminished the strength of each of these sectors’ property fundamentals. The stories behind the apartment, industrial, and office supply–demand imbalances are nuanced.
- Apartment and industrial supply surges were driven by strong demand and high rents over the past several years. As completions accelerated in the last year, apartment net absorption maintained consistent levels with its recent past, but industrial demand dropped off precipitously.
- Office demand challenges are well known, but the sector has also suffered from supply issues. Years of negative net absorption have not curtailed office net deliveries.
Meanwhile, fundamentals across the modern economy property sectors have been varied.
- Self-storage has enjoyed a history of strong operational performance, but its near-term outlook has been tempered by sluggish demand coupled with ongoing supply.
- Hotel fundamentals appear to be balanced, thanks in part to muted supply, but demand can prove to be fickle as it is heavily dependent on the economic environment.
- The outlook for health care remains positive, especially for senior housing where demand from an aging population and curtailed supply have combined.
- Data center demand continues to be fueled by ongoing developments in artificial intelligence (AI), and demand is expected to exceed supply in both the space and capital markets.
The CRE mortgage market has also changed dramatically since the end of 2021. Gone are the days of low-cost, readily available financing. Borrowers now face significantly higher debt costs and stricter underwriting standards. The public-private divergence in property valuations has further complicated the mortgage underwriting process. Many private real estate investors seeking to refinance their properties are finding themselves facing the prospects of negative leverage and/or finding their current loans cannot be refinanced at par. While the volume of impending mortgage maturities appears to be daunting, lenders’ willingness to modify and/or extend maturing loans has mitigated the level of distress in the real estate marketplace.
REITs: Greater Flexibility and Less Stress
While U.S. public equity REITs have not been immune from supply-demand imbalances and financing pressures, recent data from the Nareit Total REIT Industry Tracker Series (T-Tracker®) show that they have been resilient and reasonably well-insulated from these influences. On average, REITs have continued to deliver meaningful year-over-year funds from operations and net operating income gains. They have also maintained long-term, well-structured balance sheets with low leverage ratios, predominantly utilizing unsecured debt and fixed interest rates. Through continued balance sheet discipline, REITs are enjoying greater operational flexibility and facing less stress than their counterparts with higher debt loads and costs.
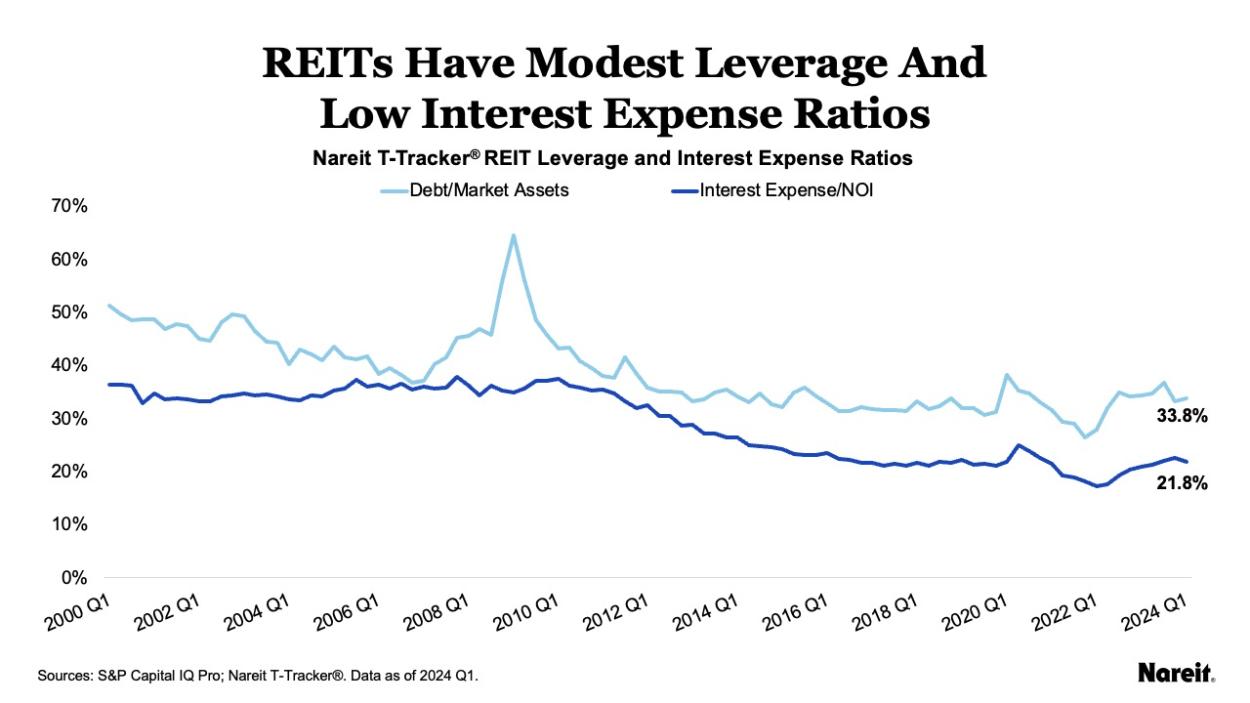
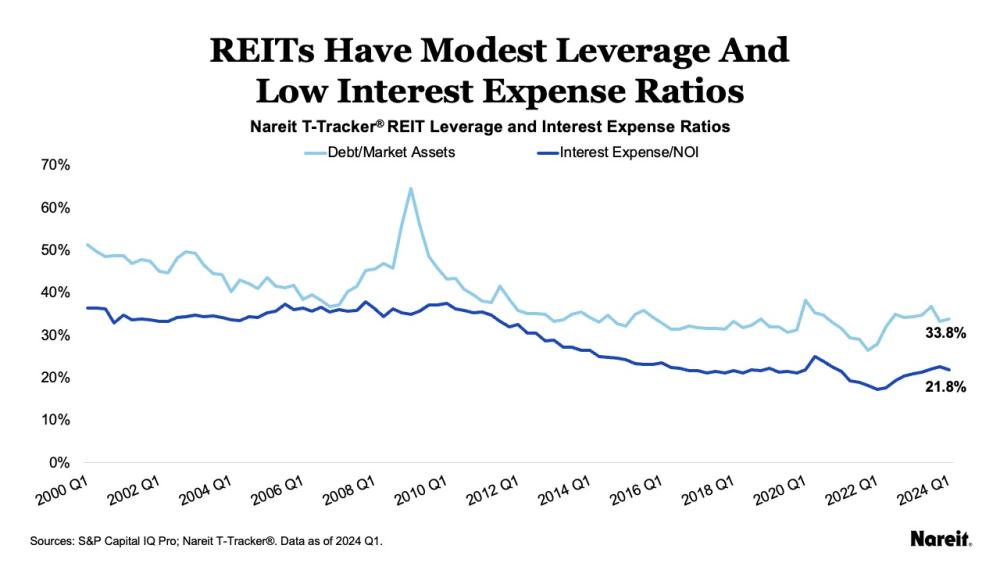
Using data from Nareit’s T-Tracker, the chart above displays average debt to market assets and interest expense to net operating income ratios since 2000.
In recent years, REITs, on average, have maintained modest leverage and low interest expense to net operating income ratios. From its peak during the Global Financial Crisis (GFC), the average leverage ratio has dropped by nearly half to 33.8% in Q1 2024; a level akin to those used in lower risk private real estate investment strategies. By focusing on unsecured, fixed rate, and longer-term debt, public equity REITs have limited their exposure to the challenges of the current mortgage market. The average interest expense ratio has followed a similar downward trend; it was 21.8% in Q1 2024. Low debt costs have afforded REITs considerable operational flexibility to address property and firm needs.
CRE Valuation Divergence: The Long Goodbye
Despite REITs’ solid operational performance and well-structured balance sheets, there has been a divergence in public and private real estate valuations since 2022. For broader context, in the past 24 years, there have been eight divergences where REITs materially underperformed private real estate on a four-quarter total return basis. These REIT relative performance troughs have also been marked by significant cap rate differences with REIT implied cap rates well exceeding private appraisal cap rates. Historically, these dislocations have presented opportunities for investors because REITs tend to outperform after these troughs.

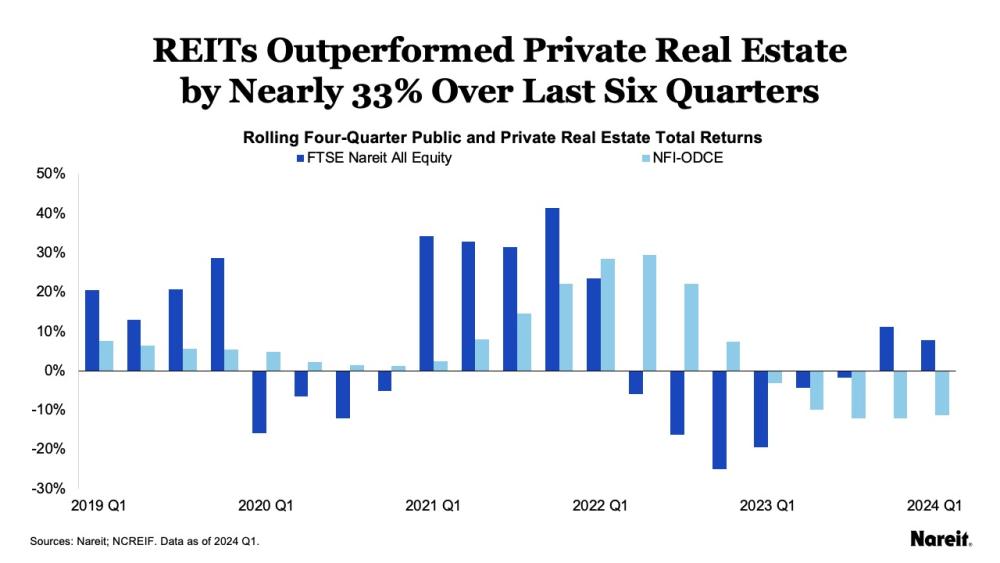
The chart above displays rolling four-quarter total returns for public and private real estate from Q1 2019 to Q1 2024. The FTSE Nareit All Equity Index and the NCREIF Fund Index–Open End Diversified Core Equity (NFI–ODCE) are utilized to measure REIT and private real estate market performances, respectively.
The chart shows a divergence between REIT and private real estate total returns in 2022. In Q3 2022, FTSE Nareit posted a four-quarter total return of -16.3% and the NFI–ODCE return was 22.1%; this difference of -38.4% marked the most significant level of REIT underperformance relative to private real estate in the history of the indices. Since that nadir, FTSE Nareit posted total returns greater than those of NFI-ODCE in five of six quarters, outperforming by 32.7% on a cumulative total return basis.
This divergence in REIT and private real estate valuation—and the ongoing slow convergence—also can be captured via differences in cap rates. As of Q1 2024, the REIT implied cap rate remained materially higher than its private appraisal counterpart. It appears that the U.S. property market has been saying a long goodbye to the current valuation dislocation.
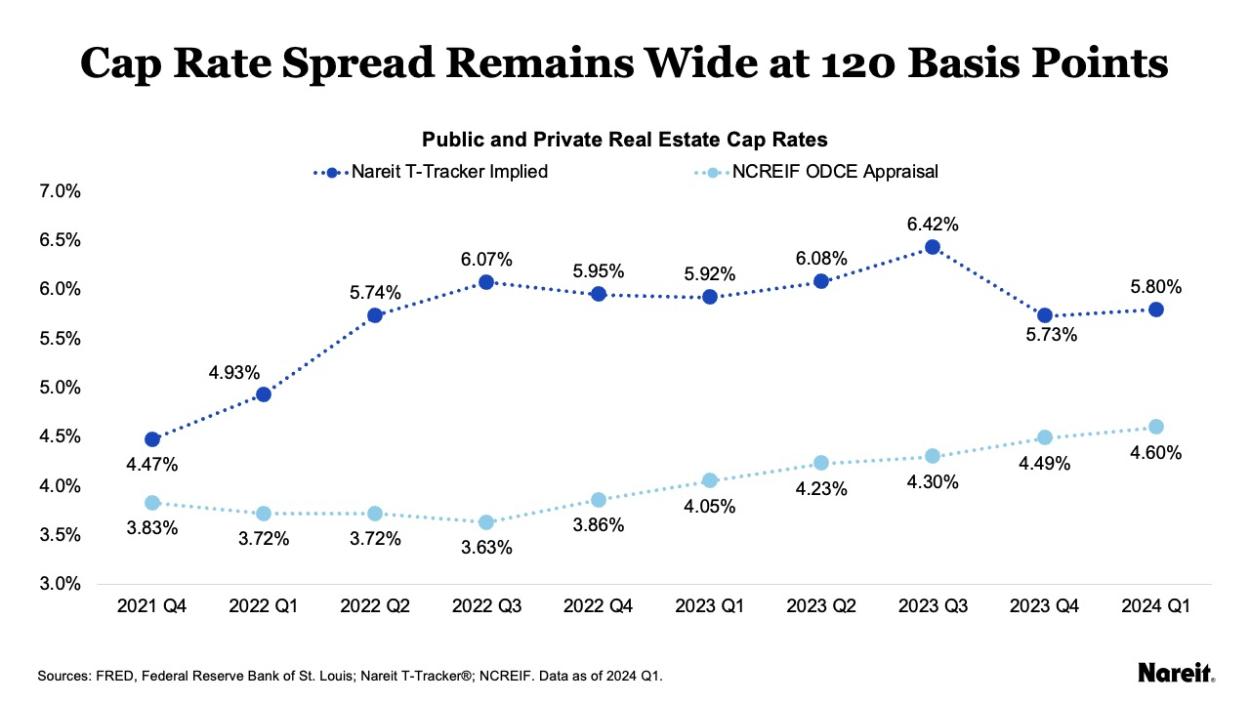
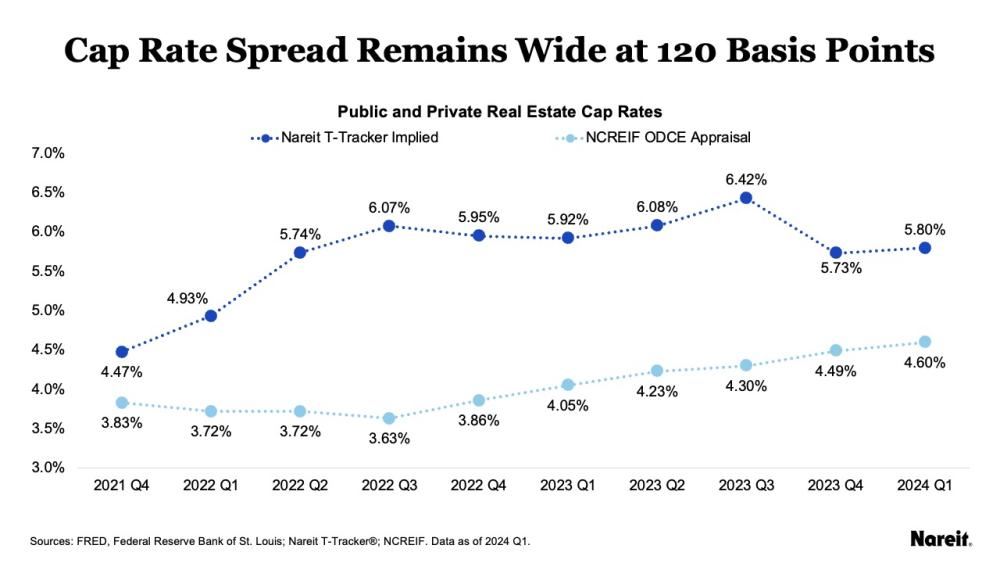
Data from Nareit and the National Council of Real Estate Investment Fiduciaries (NCREIF) shine a light on the state of the property valuation adjustment process. The chart above shows REIT implied and private appraisal cap rates since Q4 2021. The NCREIF appraisal cap rates focused on properties from open end diversified core equity (ODCE) funds.
In Q3 2022, the public-private cap rate spread peaked at 244 basis points (bps); six quarters later, it stood at 120 bps. This pace of convergence is considerably slower than that during the GFC when the cap rate gap reached a maximum of 326 bps and then fully closed in the next four quarters. The sluggishness is due, at least in part, to the modest and measured increases in appraisal cap rates. Further material write-downs are likely on the horizon for the private real estate market.
In contrast to the managed adjustments made by private property appraisers and portfolio managers, REIT valuations are governed by market forces. After monetary policy tightening ended in Q3 2023, REIT total returns surged in the following quarter, resulting in the REIT implied cap rate plunging by 69 bps. This drop reduced the cap rate spread by nearly 40%, but the gap remains wide. It presents an opportunity for real estate investors and suggests that there still may be more fuel in the tank for REIT outperformance in 2024.
CRE Investors: REITs Offer More for Less
With their pricing advantages, U.S. public equity REITs present opportunities for investors. Compared to their private real estate counterparts, on average, REITs have also maintained high absolute and relative occupancy rates across the four traditional property types. In the real estate space, REITs currently seem to offer more for less.
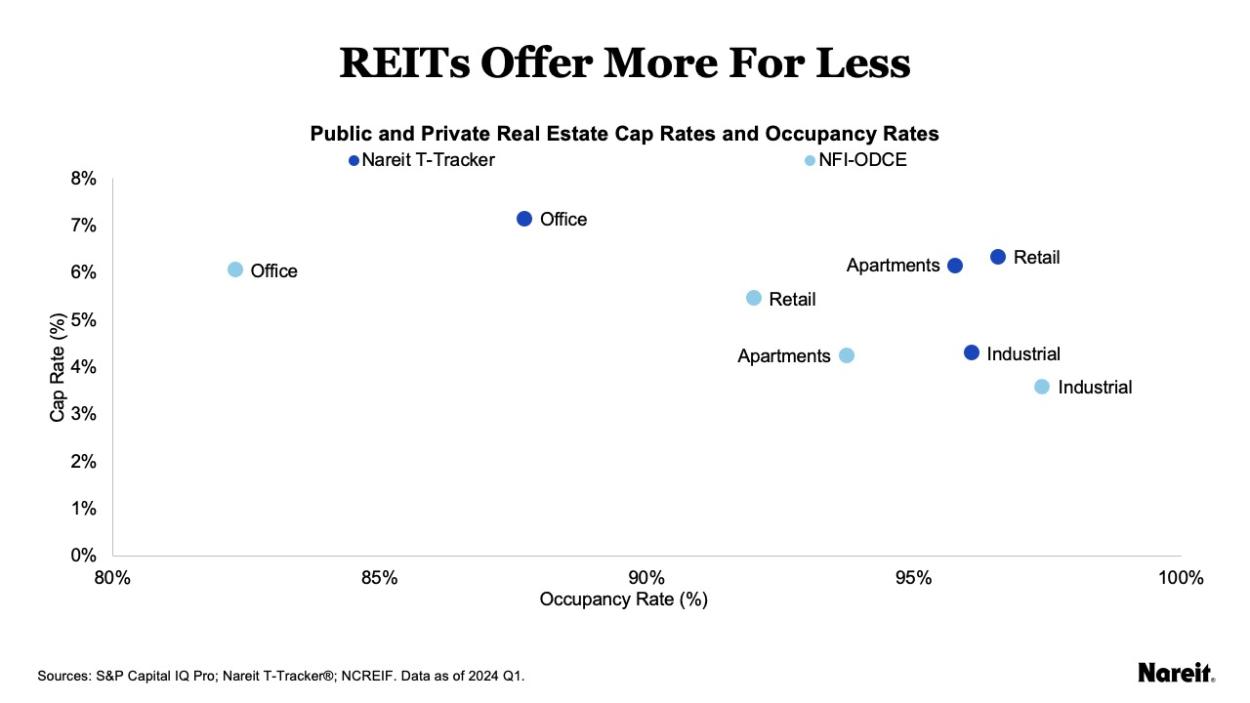
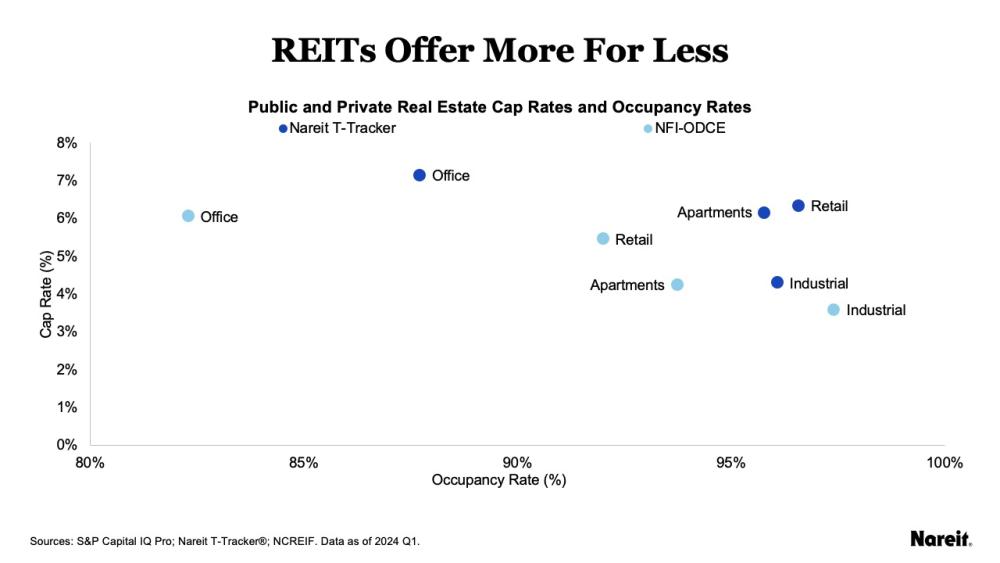
The chart above displays a scatter plot of public and private real estate cap rates and occupancy rates for the four traditional property types—apartments, industrial, office, and retail—as of Q1 2024. Data from Nareit’s T-Trackerand NCREIF ODCE funds are used for the public and private real estate measures, respectively.
The chart shows that:
- Average retail, industrial, and apartment REIT occupancy rates exceeded 95% in Q1 2024.
- Office, retail, and apartment REITs also enjoyed higher occupancy rates than their respective private market counterparts.
- Occupancy rate differences between public and private real estate were 5.4% (office), 4.6% (retail), and 2.0% (apartments).
- The REIT industrial occupancy rate lagged the NCREIF ODCE measure by 1.3%, but maintained an exceptionally high level at 96.1%.
These high absolute and relative results showcase REITs’ prowess when it comes to asset selection and management.
The chart also illustrates that:
- REIT implied cap rates exceeded their respective NCREIF ODCE appraisal cap rates across each of the four traditional property types.
- In Q1 2024, the public-private cap rate spreads were 190 bps (apartment), 108 bps (office), 83 bps (retail), and 72 bps (industrial).
All else equal, these significant spreads suggest that REITs offer more attractive pricing relative to private real estate across each of the examined property types. Pricing in some sectors like apartments remains particularly compelling. Pricing advantages combined with high absolute and relative occupancy rates suggest that REITs currently offer more for less in the CRE market.
REITs: Well-Positioned to Navigate the Rest of 2024
Despite headwinds and lackluster returns, U.S. public equity REITs are well-positioned for the remainder of 2024. Solid operational performance and disciplined balance sheets are expected to enable REITs to enjoy greater operational flexibility and face less stress than their counterparts with higher debt loads and costs. The combination of REIT occupancy rate and pricing advantages presents a potential opportunity for investors, especially for those that appreciate good value. The ongoing public-private real estate valuation divergence and current wide cap rate spread also suggest that there is likely more fuel in the tank for continued REIT outperformance in 2024.
To read more of Nareit’s analysis, including the quarterly T-Tracker, sign up for Nareit’s quarterly research newsletter.