While publicly traded equity REIT performance has recently been exhibiting an inverse relationship with U.S. 10-year Treasury yield movements, this has not always been the case. Historical data show that both positive and negative correlations have been observed between REIT total returns and 10-year Treasury yield changes, with each relationship occurring for roughly equal periods of time since 2000.
These changes do not reflect market fickleness. Investor sentiment metrics like yield curve (term) spreads and future recession probabilities can provide additional insights into the fluctuating relationship between REIT total returns and 10-year Treasury yield changes.
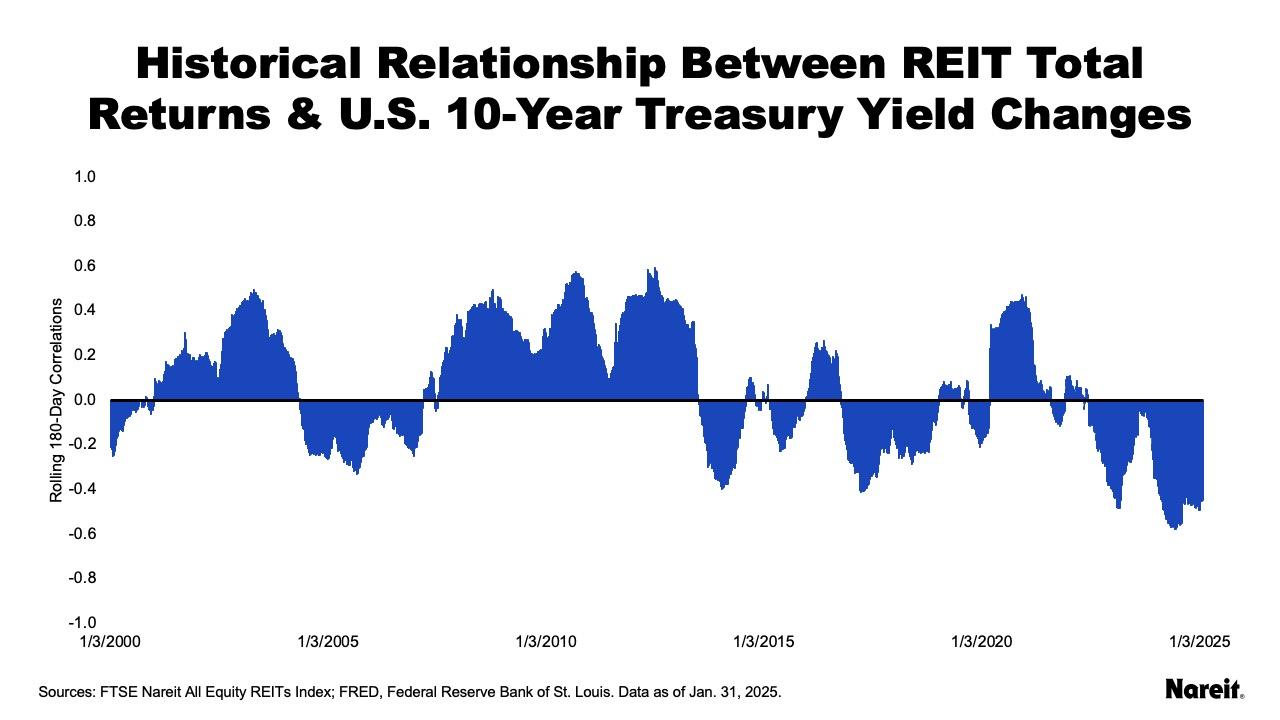
The chart above highlights how the relationship between REIT performance and 10-year Treasury yields has changed over time. It displays rolling 180-day correlations between REIT total returns calculated from the FTSE Nareit All Equity REITs Index and U.S. 10-year Treasury yield changes from the beginning of 2000 through the end of January 2025.
Historically, REIT total returns and 10-year Treasury yield changes have exhibited both positive and negative relationships. Tallies of the data revealed that 53.3% and 46.7% of total days exhibited positive and negative correlations, respectively. During the global financial crisis, the relationship was positive. More recently, it has been more negative than positive.
Why has the relationship between these two variables changed so frequently? One metric that may be able to provide some additional context is the slope of the yield curve, or term spread, which is calculated as the difference between long- and short-term interest rates.
The term spread is a well-recognized signal of future economic activity and popular (although imprecise) predictor of economic recessions. A positive term spread indicates a normal yield curve, which is upward sloping and tends to be associated with an optimistic outlook on the economy. A flat yield curve has a slope (term spread) of zero; it typically reflects an economy transitioning from expansion to contraction, and vice versa. When the term spread is negative, the yield curve is inverted, or downward sloping; this is often viewed as a signal for an upcoming recession.
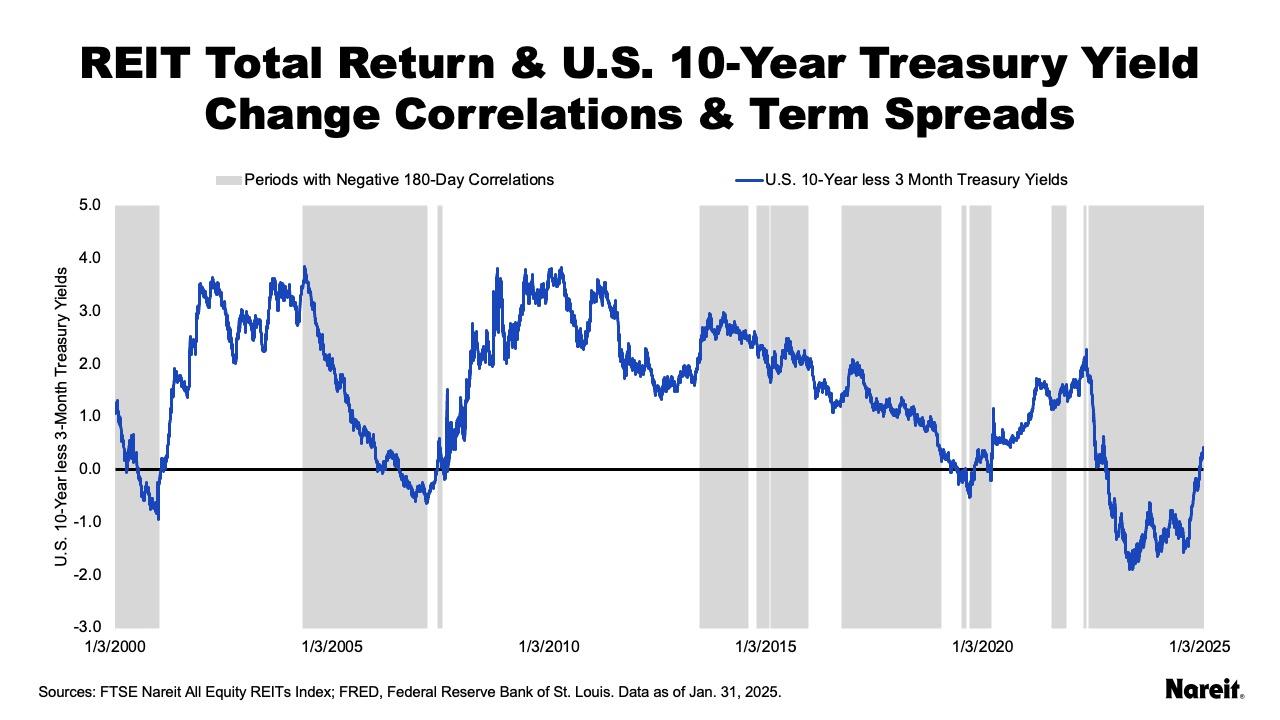
The chart above presents term spreads and periods of negative and positive correlations between REIT total returns and U.S. 10-year Treasury yield changes since 2000. The term spread is the difference between the U.S. 10-year and 3-month Treasury yields. Periods with negative 180-day correlations are shaded gray; non-shaded areas reflect positive correlations.
Periods with negative correlations tended to be characterized by compressing, low, or negative term spreads. Yield curve flattening, i.e., term spread compression, often indicates an expected slowing of economic activity. An inverted yield curve, i.e., negative term spread, is also viewed as an indicator of economic slowdown, and predictor of future recession. The negative relationship between REIT performance and 10-year Treasury yield changes appears to have been prevalent when the economic outlook has been pessimistic.
Positive correlation periods have been characterized by increasing or high term spreads. The steepening of the yield curve, i.e., increasing term spread, is typically tied to beliefs of a strengthening economy. It looks as if the positive relationship between REIT total returns and 10-year Treasury yield changes has prevailed during periods with optimistic economic outlooks.
Given that economists have typically viewed the term spread as a good signal or predictor of an upcoming economic downturn, future recession probabilities may be another metric that can provide some additional understanding into the observed changing relationship between REIT total returns and 10-year Treasury yield changes.
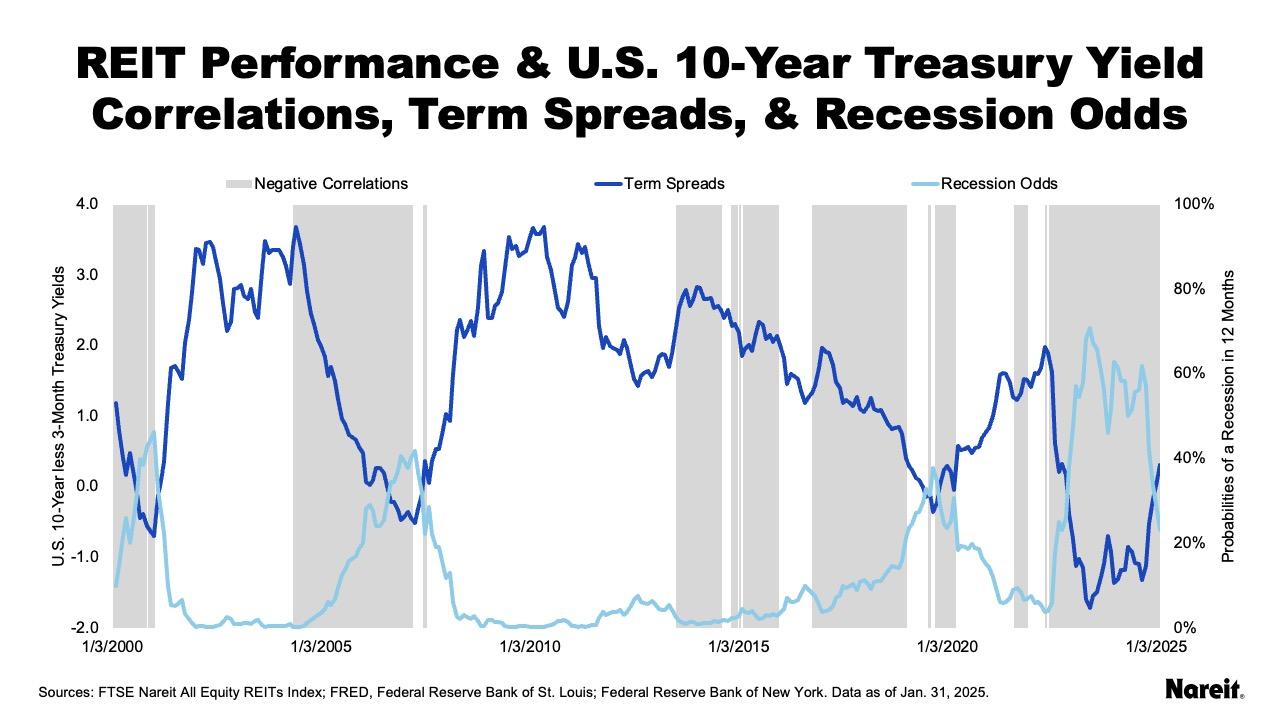
The chart above presents term spreads, probabilities of a U.S. recession in 12 months, and periods of negative and positive correlations between REIT total returns and U.S. 10-year Treasury yield changes from the beginning of 2000 to the end of January 2025. The monthly calculated 10-year less 3-month Treasury term spreads and estimated recession probabilities are maintained and available from the Federal Reserve Bank of New York. Days with negative 180-day correlations are shaded gray; days with positive correlations are not shaded.
The monthly term spreads look similar to the daily data in the previous chart. As anticipated, the probabilities of a U.S. recession in 12 months exhibited an inverse relationship with term spreads. Higher spreads are associated with lower recession odds, and vice versa. Periods with negative correlations have typically been related to rising or high recession likelihoods. Positive correlation periods have generally been characterized by decreasing or low economic downturn probabilities. Again, the negative and positive relationships between REIT total returns and 10-year Treasury yield changes appear to have typically been prevalent with pessimistic and optimistic economic outlooks, respectively.
Through the actions of the Federal Open Market Committee (FOMC), the U.S. has essentially gone through a period of higher short-term interest rates over the past 36 months. The FOMC’s monetary policy tightening was intended to slow economic activity and the demand for credit. As evidenced in the chart above, it flattened and then inverted the yield curve, resulting in higher recession likelihoods. With the term spread now turning positive, the economy may be in a transition period. If the yield curve continues to steepen and recession probabilities decline, a reversion or neutralization of the negative correlation between REIT total returns and 10-year Treasury yield changes may be on the horizon.
REIT total returns have recently been exhibiting an inverse relationship with U.S. 10-year Treasury yield changes, however, historical data show that both positive and negative correlations have been observed between these two variables for roughly equal periods of time since 2000.
Term spreads and future recession odds are two measures that may provide some additional context into the observed fluctuating relationship. These metrics show that negative correlations between REIT total returns and 10-year Treasury yield changes have generally been associated with pessimistic economic outlooks; positive correlations have typically been associated with optimistic outlooks. Today, the term spread has moved out of negative territory. If the yield curve steepens and the probability of a recession in the next year falls, the relationship between REIT performance and 10-year Treasury yields may soon change again.
Other Market Commentaries in this series: