The return of higher interest rates has become a source of consternation for some commercial real estate (CRE) investors. Many are concerned about how CRE may fare in a prolonged environment of elevated interest rates. Yet, high(er) interest rates do not necessarily equate to weak, or poor, real estate performance. While no guarantee of future results, historical data show that, on average, real estate has enjoyed solid total returns across different interest rate regimes with REITs consistently outperforming their private market counterparts.

The chart above displays average calendar year U.S. 10-year Treasury yields from 1992, the start of the modern REIT era, to 2024. Annual yield data was placed into three equal groups, i.e., tertiles, and color coded. The low (first tertile) 10-year Treasury yield group is shaded light green, the mid (second tertile) group is colored light blue, and the high (third tertile) group is designated by bright blue.
For most of the examination period (1994 to 2020), the U.S. Treasury yield followed a general downward trend. After more than a decade of low interest rates, the 10-year Treasury yield started to move materially higher in 2022. Although increasing yields tend to signal an improving economic outlook, today’s debt markets have priced in meaningful fiscal uncertainty due to the possibilities of deficits, tariffs and trade conflicts, and higher inflation.
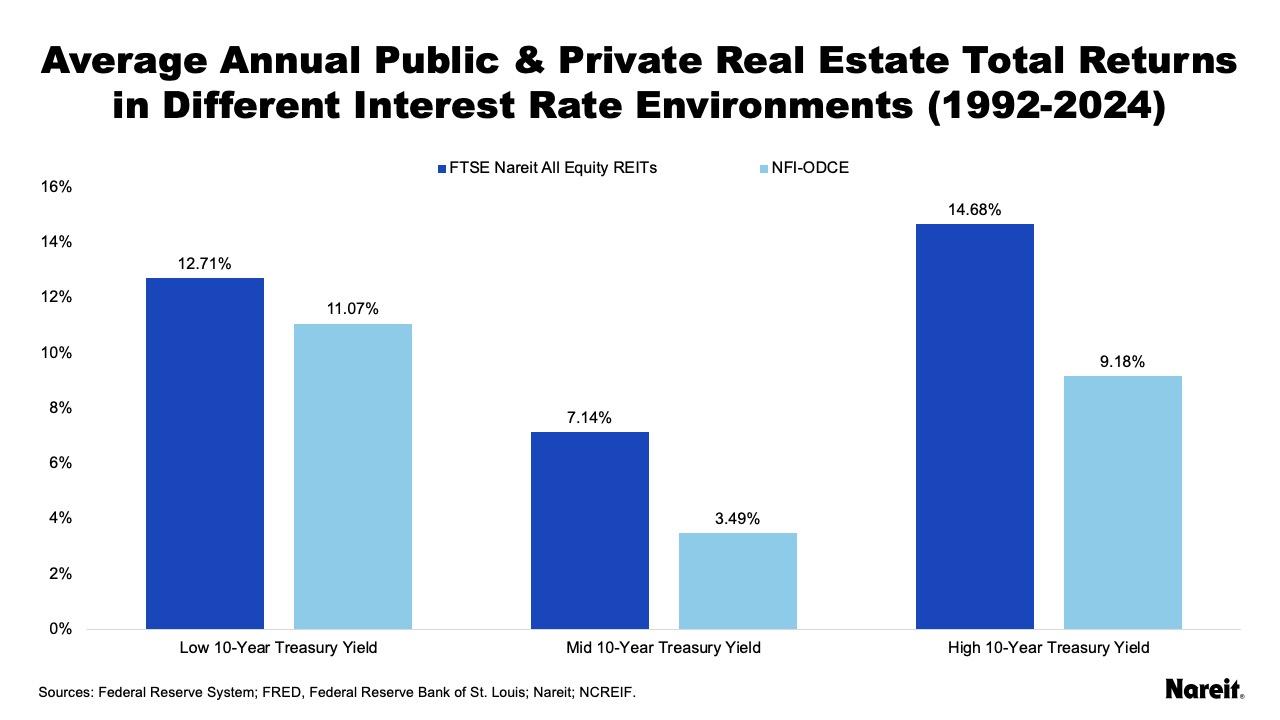
The chart above displays average calendar year total returns for public and private real estate in different interest rate environments from 1992 to 2024. Interest rates were measured by U.S. 10-year Treasury yields. The FTSE Nareit All Equity REITs Index and the NCREIF Fund Index—Open End Diversified Core Equity (NFI–ODCE) were used to measure public and private real estate performances, respectively.
Data was again broken down by U.S. 10-year Treasury yields into three equal groups. Treasury yields for the low (first tertile) interest rate group ranged from 0.89% to 2.91%. The range for the mid (second tertile) group was 2.95% to 4.63%. Yields for the high (third tertile) group ranged from 4.80% to 7.09%. Although CRE investors may be worried about high(er) interest rates, the current 10-year Treasury yield is not particularly elevated in an historical context; it falls within the second tertile.
Historical data show that, on average, CRE has performed well in different interest rate regimes. Both public and private real estate posted positive average total returns across all three interest rate groups. REITs also bested private real estate performance in each cohort. Moving from the low to high 10-year Treasury yield groupings, the spread between public and private real estate average calendar year total returns progressively increased. Average annual total return spreads for the low, mid, and high groups were 1.64%, 3.65%, and 5.50%, respectively.
While the possibility of an extended period of higher interest rates may be unsettling for some CRE investors, historical data show that, on average, real estate has performed well across a variety of interest rate regimes and that REITs have outperformed their private market counterparts. With pricing that reflects market conditions, REITs are particularly well positioned to face the current higher interest rate environment. Other factors that provide REITs with a competitive edge over typical CRE investors include their best-in-class operational expertise, disciplined balance sheets, and efficient and ready access to cost-advantaged capital from a variety of sources including equity, debt, and joint venture (JV) partnerships.
Other Market Commentaries in this series: