Rising interest rates worry real estate investors. Their fears are rooted in the view that interest rate increases will result in rising cap rates and, all else being equal, declining property values. This belief oversimplifies reality. Rising interest rates do not necessarily equate to weak, or poor, real estate performance.
Historical data from the first quarter of 1992, the beginning of the modern REIT era, to the fourth quarter of 2024, show that REITs have generally enjoyed positive total returns in both rising and falling interest rate environments, posting gains in 78.0% and 78.1% of increasing and decreasing interest rate periods, respectively. The data also show that the economic backdrop has played a critically important role in REIT investment performance.
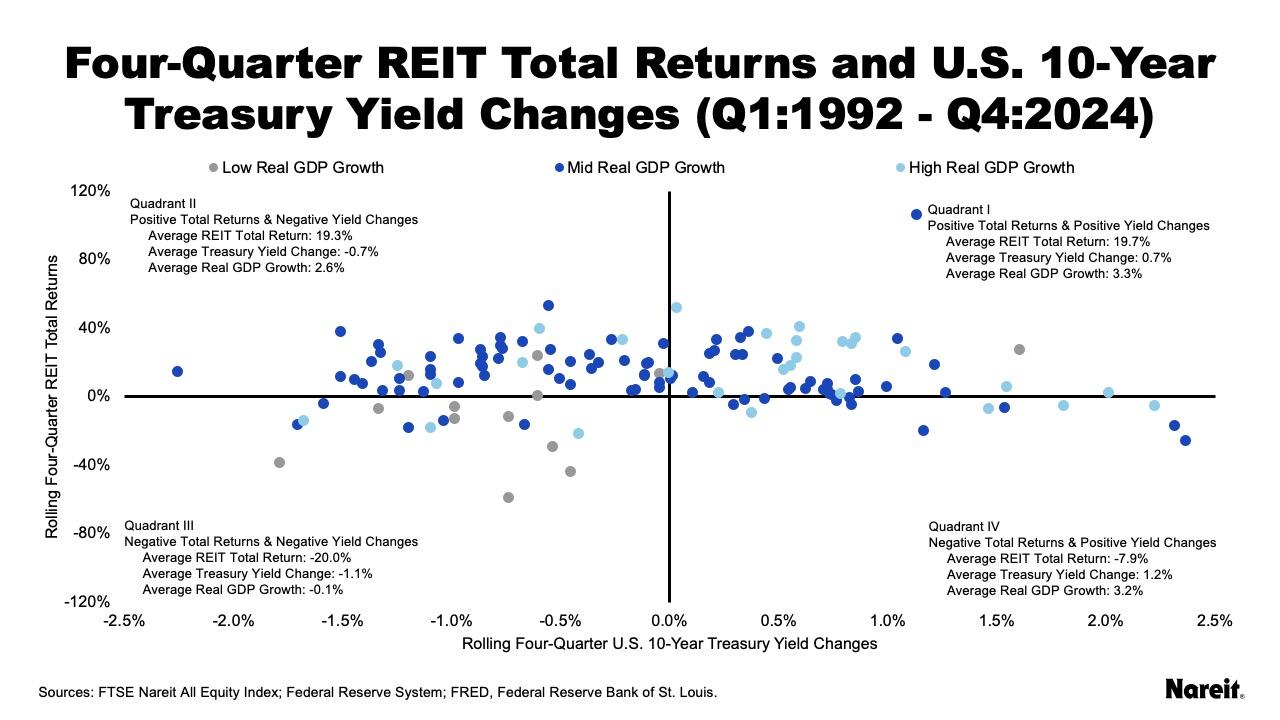
The chart above is divided into quadrants and displays a scatter plot of four-quarter changes in the 10-year Treasury yield and four-quarter total returns on the FTSE Nareit All Equity REITs Index using quarterly data from 1992 to 2024. Data points are color-coded to reflect four-quarter real GDP growth rates. Economic growth rate thresholds for the low and high groups were set at 1% and 4%, respectively. The low real GDP growth group is shaded gray, the mid group is colored dark blue, and the high group is designated by light blue.
Quadrants I (positive total returns and positive yield changes) and IV (negative total returns and positive yield changes) include 59 periods that experienced a rise in the Treasury yield. A tally of the observations in Quadrant I shows that REITs posted positive total returns in 78.0% of the rising interest rate periods. The average four-quarter REIT total return for Quadrant I was 19.7%, the highest among the quadrants. Return performance for Quadrant IV averaged -7.9%. Economic growth was typically healthy during the rising yield periods. Average four-quarter real GDP growth rates were 3.3% and 3.2% for Quadrants I and IV, respectively, and only one period of low real GDP growth was observed.
These results are consistent with market interest rates typically increasing and CRE fundamentals generally improving during periods of strengthening macroeconomic conditions. This same strength often drives REIT operational performance, including higher occupancy rates, stronger rent growth, and increased net operating income and funds from operations.
Quadrants II (positive total returns and negative yield changes) and III (negative total returns and negative yield changes) include 73 periods that experienced a decline in the Treasury yield. A tally of the observations in Quadrant II shows that REITs posted positive total returns in 78.1% of declining yield periods. The average four-quarter REIT total return for Quadrant II was 19.3%. In contrast, Quadrant III performance averaged -20.0%. Twelve of the 13 low real GDP growth periods were observed in the falling yield periods; 75% of these were in Quadrant III. Average four-quarter real GDP growth in Quadrant II was a respectable 2.6%; it was -0.1% for Quadrant III.
Quadrant II results likely stem from the negative correlation between REIT total returns and 10-year Treasury yield changes that is observed periodically. Since 2022, REIT performance has generally followed an inverse relationship with Treasury yield movements. Quadrant III shows that falling yields and weak economies have often been a recipe for poor REIT returns.
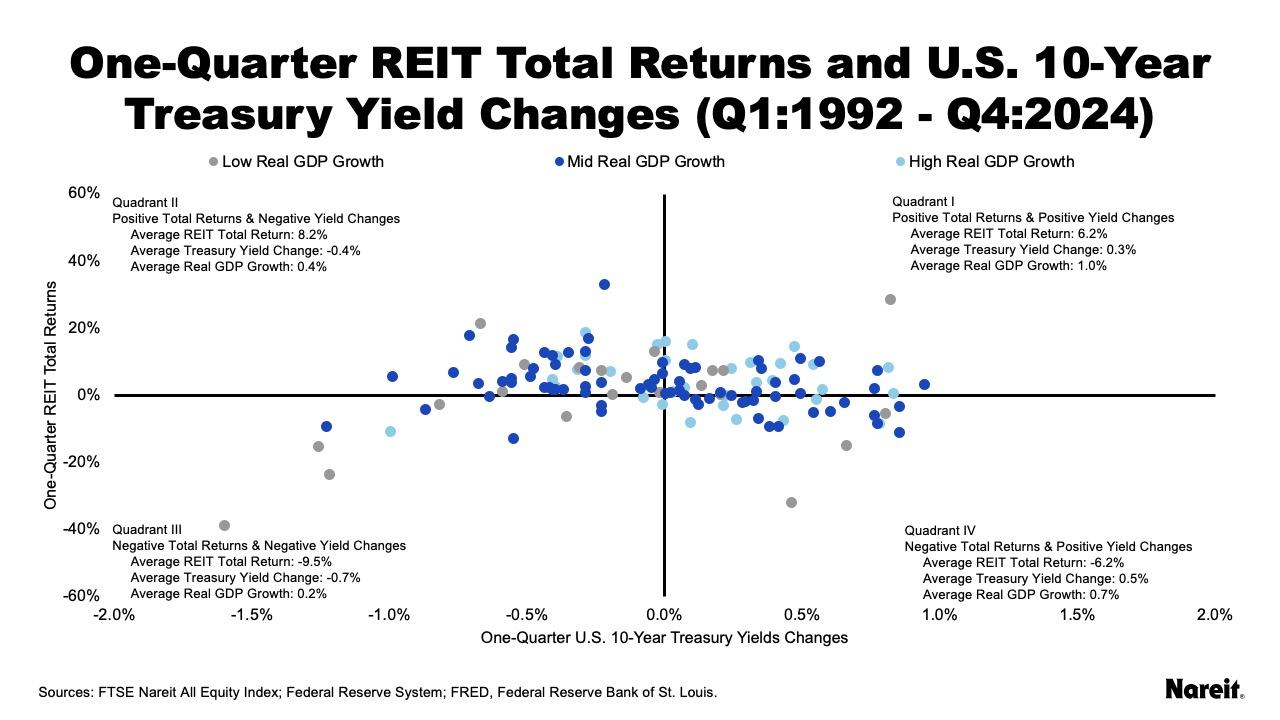
The chart above acts as a check on the robustness of the initial results. It displays a scatter plot of one-quarter 10-year Treasury yield changes and four-quarter FTSE Nareit All Equity REITs Index total returns. Data points are similarly color-coded, but reflect one-quarter real GDP growth rates. Thresholds for the low and high groups were 0.25% and 1.0%, respectively.
A comparison of the four-quarter and one-quarter analyses shows that the results were similar.
- REITs continued to post positive total returns in the majority of rising and falling 10-year Treasury yield periods. For the one-quarter analysis, REITs posted positive total returns in 61.8% and 78.1% of the rising and falling interest rate periods, respectively.
- Real GDP growth, on average, continued to be stronger in rising interest rate periods. One-quarter real GDP growth rates averaged 1.0% and 0.7% for Quadrants I and IV, respectively. They were 0.4% for Quadrant II and 0.2% for Quadrant III.
- The majority of the low real GDP growth periods continued to be observed in falling yield periods, Quadrants II and III. In the one-quarter analysis, 14 of the 22 low real GDP growth periods were observed in the falling interest rate periods.
- Falling yields and weak economies continued to be a recipe for poor REIT returns. Once again, Quadrant III had the weakest economic and REIT performances. The one-quarter real GDP growth rate and REIT total return averaged 0.2% and -9.5%, respectively.
While rising interest rates may worry some real estate investors, historical data show that REITs have performed well during both periods of rising and falling long-term interest rates. The data also show that economic conditions play an important role in REIT total return performance. Today, real estate investors should find some comfort in the current strength of the U.S. economy. In addition, REITs are particularly well positioned to face a changing interest rate environment. Factors that provide REITs with a competitive edge over typical CRE investors include their market pricing, best-in-class operational expertise, disciplined balance sheets, and efficient and ready access to cost-advantaged capital.
Other Market Commentaries in this series: